Integrative Bayesian Analysis of High-dimensional Multiplatform Genomics Data
Posted on
the paper proposed an integrative Bayesian analysis of genomic data (iBAG) framework for identifying important genes/biomarkers that are associated with clinical outcome.
- use hierarchical modeling to combine the data obtained from multiple platforms into one model
results
- assess the performance using several synthetic and real examples
- using the Cancer Genome Atlas glioblastoma dataset, apply the iBAG model to integrate gene expression and methylation data to study their associations with patient survival
- the method discovers multiple methylation-regulated genes that are related to patient survival.
three general groups of integration studies
- sequential integration
- biological integration
- model-based integration
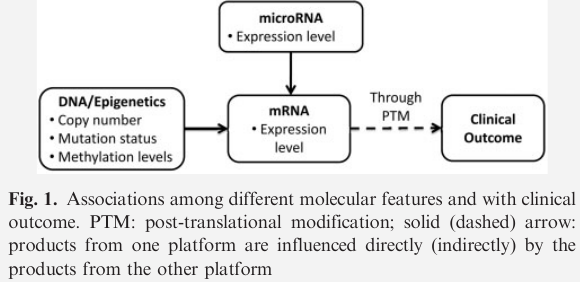
Molecular biology has shown that features identified on different platforms influence clinical outcome at different levels.
iBAG model
- uses a hierarchical approach to model the fundamental biological relationships underlying molecular features obtained by different platforms
- accounts for both the influences of different platforms and the biological relationships among the platforms in one unified model to predict patients’ clinical outcomes
- can conduct high-dimensional variable selection, which adapts to analyzing hundreds of distinct molecular entity effects jointly in one model
- use a Bayesian framework, which allow the model enough flexibility to estimate the different intrinsic structures of biological relationships for different high-throughput platforms
- computationally efficient and feasible owing to its closed forms of full conditional posterior distributions for posterior sampling
iBAG model
illustrate with two platforms data
- DNA methylation
- gene expression data
data
- $Y_n$: clinical outcome of patient $n, n=1,\ldots,N$
- $(m_{n1},\ldots,m_{nJ})$: measures of methylation levels for $J$ probes/sites on the whole genome
- $(g_{n1},\ldots,g_{nK})$: measures of gene expression level for $K$ genes
- $(c_{n1},\ldots,c_{nL})$: $L$ clinical (non-genomic) factors (e.g., tumor stage, age and other demographic variables)
denote as ${Y_{N\times 1}, M_{N\times J}, G_{N\times K}, C_{N\times L}}$
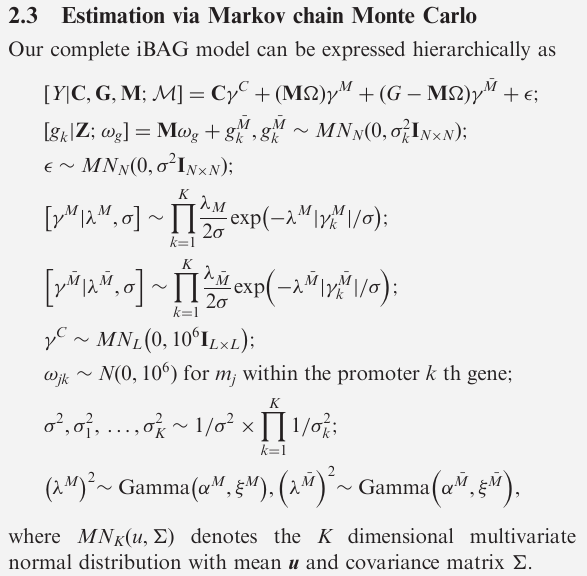
propose two-component hierarchical construction for iBAG model
- mechanistic model to infer direct effects of methylation on gene expression
- clinical model to predict a clinical outcome
The expression level of a gene
- is affected primarily by the methylation sites in the promoter region
- and is usually lower when its promoter is highly methylated
- however, methylation is only one of the many potential factor contributing to a change in gene expression level
- $G^M=(g_{nk}^M)_{N\times K} = (g_1^M,\ldots,g_K^M)$, where $g_k^M$ denotes the part of the expression changes of the $k$-th gene expression feature that is modulated through methylation $M$
- $G^{\bar M} = (g_1^{\bar M},\ldots, g_K^{\bar M})$
- $\Omega = (\omega_{jk})_{J\times K}$, where $\omega_{jk}$ is the “gene-methylation” effect that estimates the (conditional) effect of the $j$-th methylation feature on the $k$-th feature identified from the gene expression data
prior construction
- bayesian lasso prior for the type M effect $\gamma^M$, and type $\bar M$ effect $\gamma^{\bar M}$
- for $\Omega$,
- if the number of features is lower than $N$, then assume $\omega_{jk}\sim N$ if $m_j$ is within the $k$-th gene promoter; otherwise $\omega_{jk}=0$
- if … exceeds $N$ (e.g., microRNA feature), allow for a Bayesian lasso prior
- prior of each $\gamma_l^C$ is multivariate normal
- improper prior on the error variance
Gene Selection via FDRs
for each MCMC sample, compute the (conditional) MAP estimate of $\gamma_s^M, \gamma_s^{\bar M}$
estimate the posterior probability of significance $(p_k^M, p_k^{\bar M})$ by computing the (empirical) frequencies of the nonzero elements in the MAP estimates for each gene $k$.
in this framework, $(1-p_k^M)$ and $(1-p_k^{\bar M})$ can be interpreted as estimates of the local FDR or Bayesian $q$-values. Thus, given a desired global FDR $\alpha$, we can determine a threshold $\phi_\alpha$ to use in flagging the set of genes ${k:p_k^M\ge \phi_\alpha,\text{or} p_k^{\bar M}\ge \phi_\alpha}$ as significant genes associated with the clinical outcome.
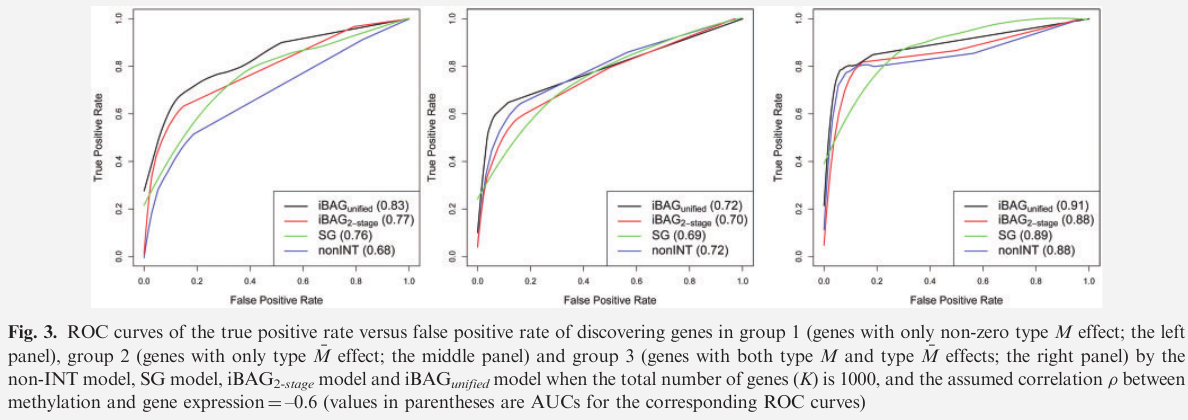
Simulation Studies
two versions of the iBAG model
- iBAG unified model
- iBAG 2-stage model
compare with two other models
- a non-integrative model (non-INT)
- a single gene model (SG)
TCGA Glioblastoma Multiforme Dataset
TCGA GBM dataset includes tumor samples from >500 patients with GBM, along with DNA copy number, mutation, methylation and gene expression information.
The paper focus on integrating gene expression, methylation data and patients’ clinical features from the GBM study.
Discussion
- propose iBAG to integrate two different platforms of omics data and estimate their associations with clinical outcomes
- categorize all clinically relevant genes into three groups according to different biological mechanisms
main goal of iBAG
- identify more disease-associated genes
- achieve better predictive power