DNA copy number profiling: from bulk tissue to single cells
Posted on
This post is based on the talk given by Yuchao Jiang at the 11th ICSA International Conference on Dec. 20th, 2019.
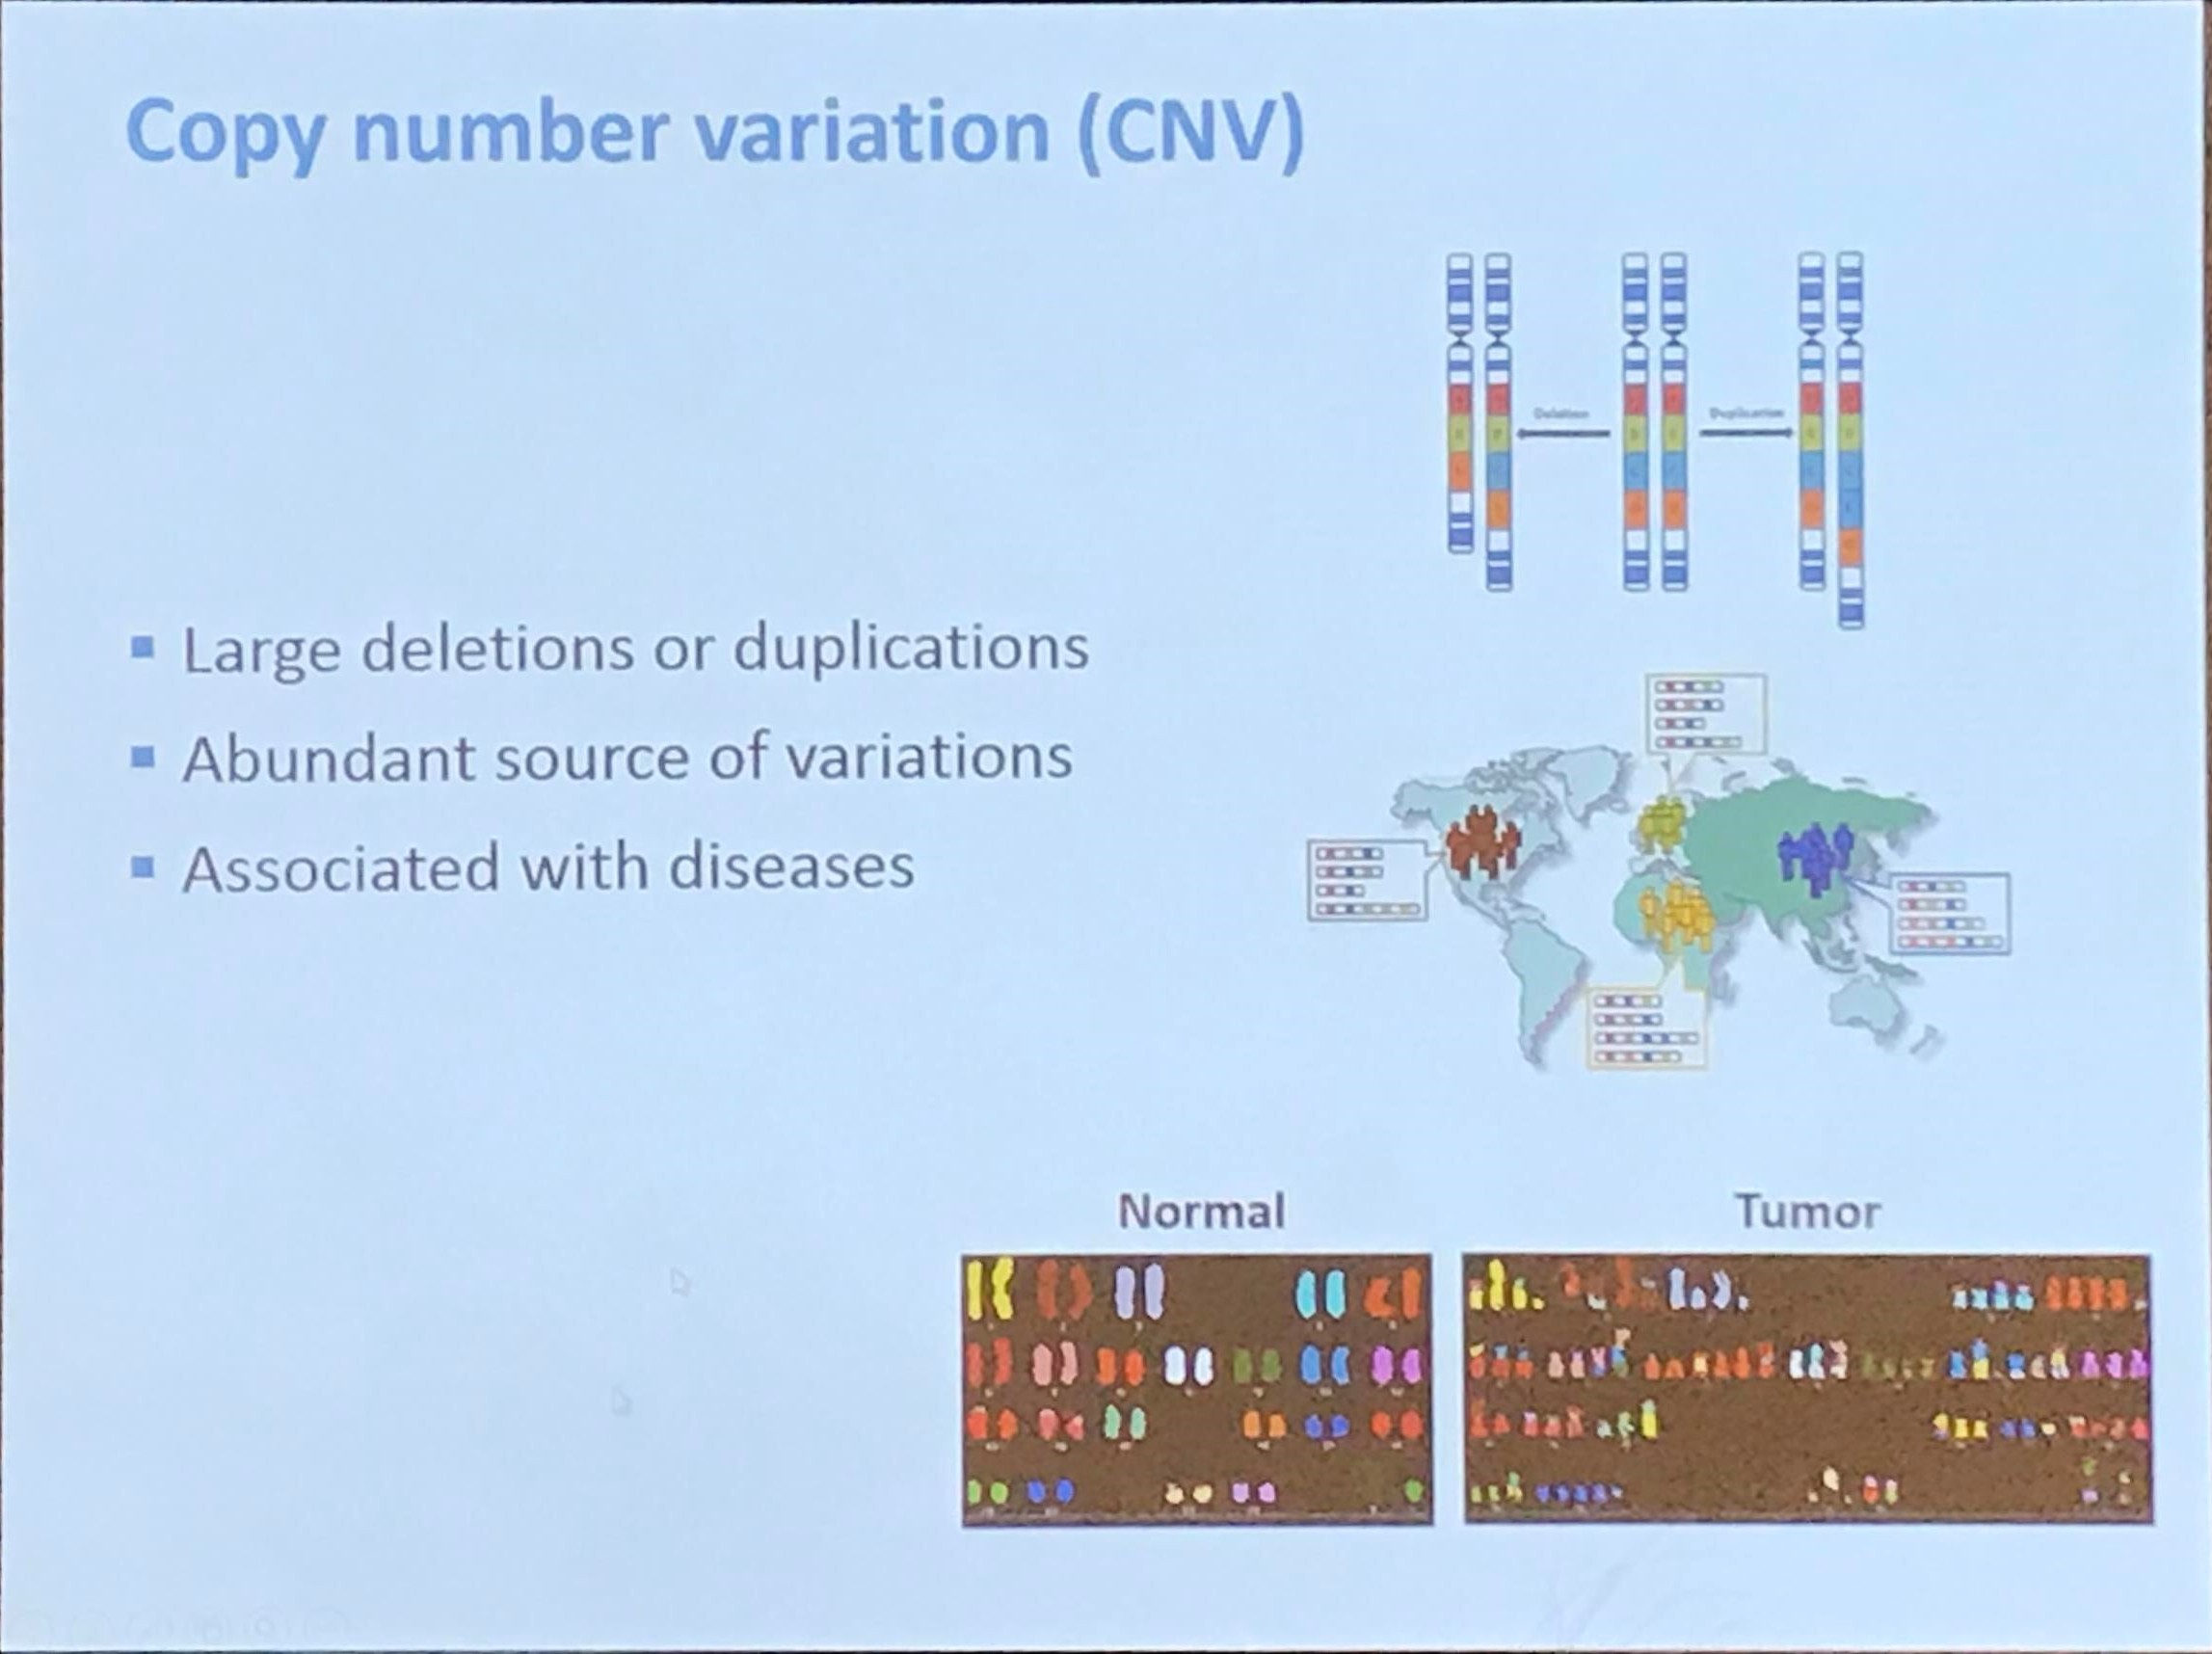
Copy number variation (CNV)
CNV detection by next-generation DNA-seq
Bulk DNA-seq:
- Whole-genome sequencing (WGS)
- Whole-exome sequencing (WES) & targeted sequencing
Single-cell DNA-seq:
- Conventional whole-genome amplification
- 10X Genomics Chromium Single Cell CNV Solution
Goal
Use bulk/single-cell DNA sequencing to accurately detect CNV
- Based on depth of coverage, i.e., number of times a genomic region is “read”
Biases:
- GC content
- Capture and amplification efficiency
- Sequencing bias
- Latent factors
- Batch effect
- Population stratification
Existing Works
Fromer et al. (2012) said that
Because exome sequencing takes aim at a sparse (~1%) set of noncontiguous genomic targets (the exons), most CNV breakpoints will not be sequenced, leaving read depth as the predominant indicator of CNVs. However, the quantitative relationship between true copy number and depth is distorted by target- and sample-specific biases in exome hybridization (“capture”), PCR amplification, sequencing efficiency, and in silico read mapping, all of which are in turn affected by GC content of the targets, target size and sequence complexity, proximity to segmental duplications, nucleotide-level variation (SNPs), DNA concentration, hybridization temperature, experimental sample batching, and the complex interplay among these and various indeterminate factors.
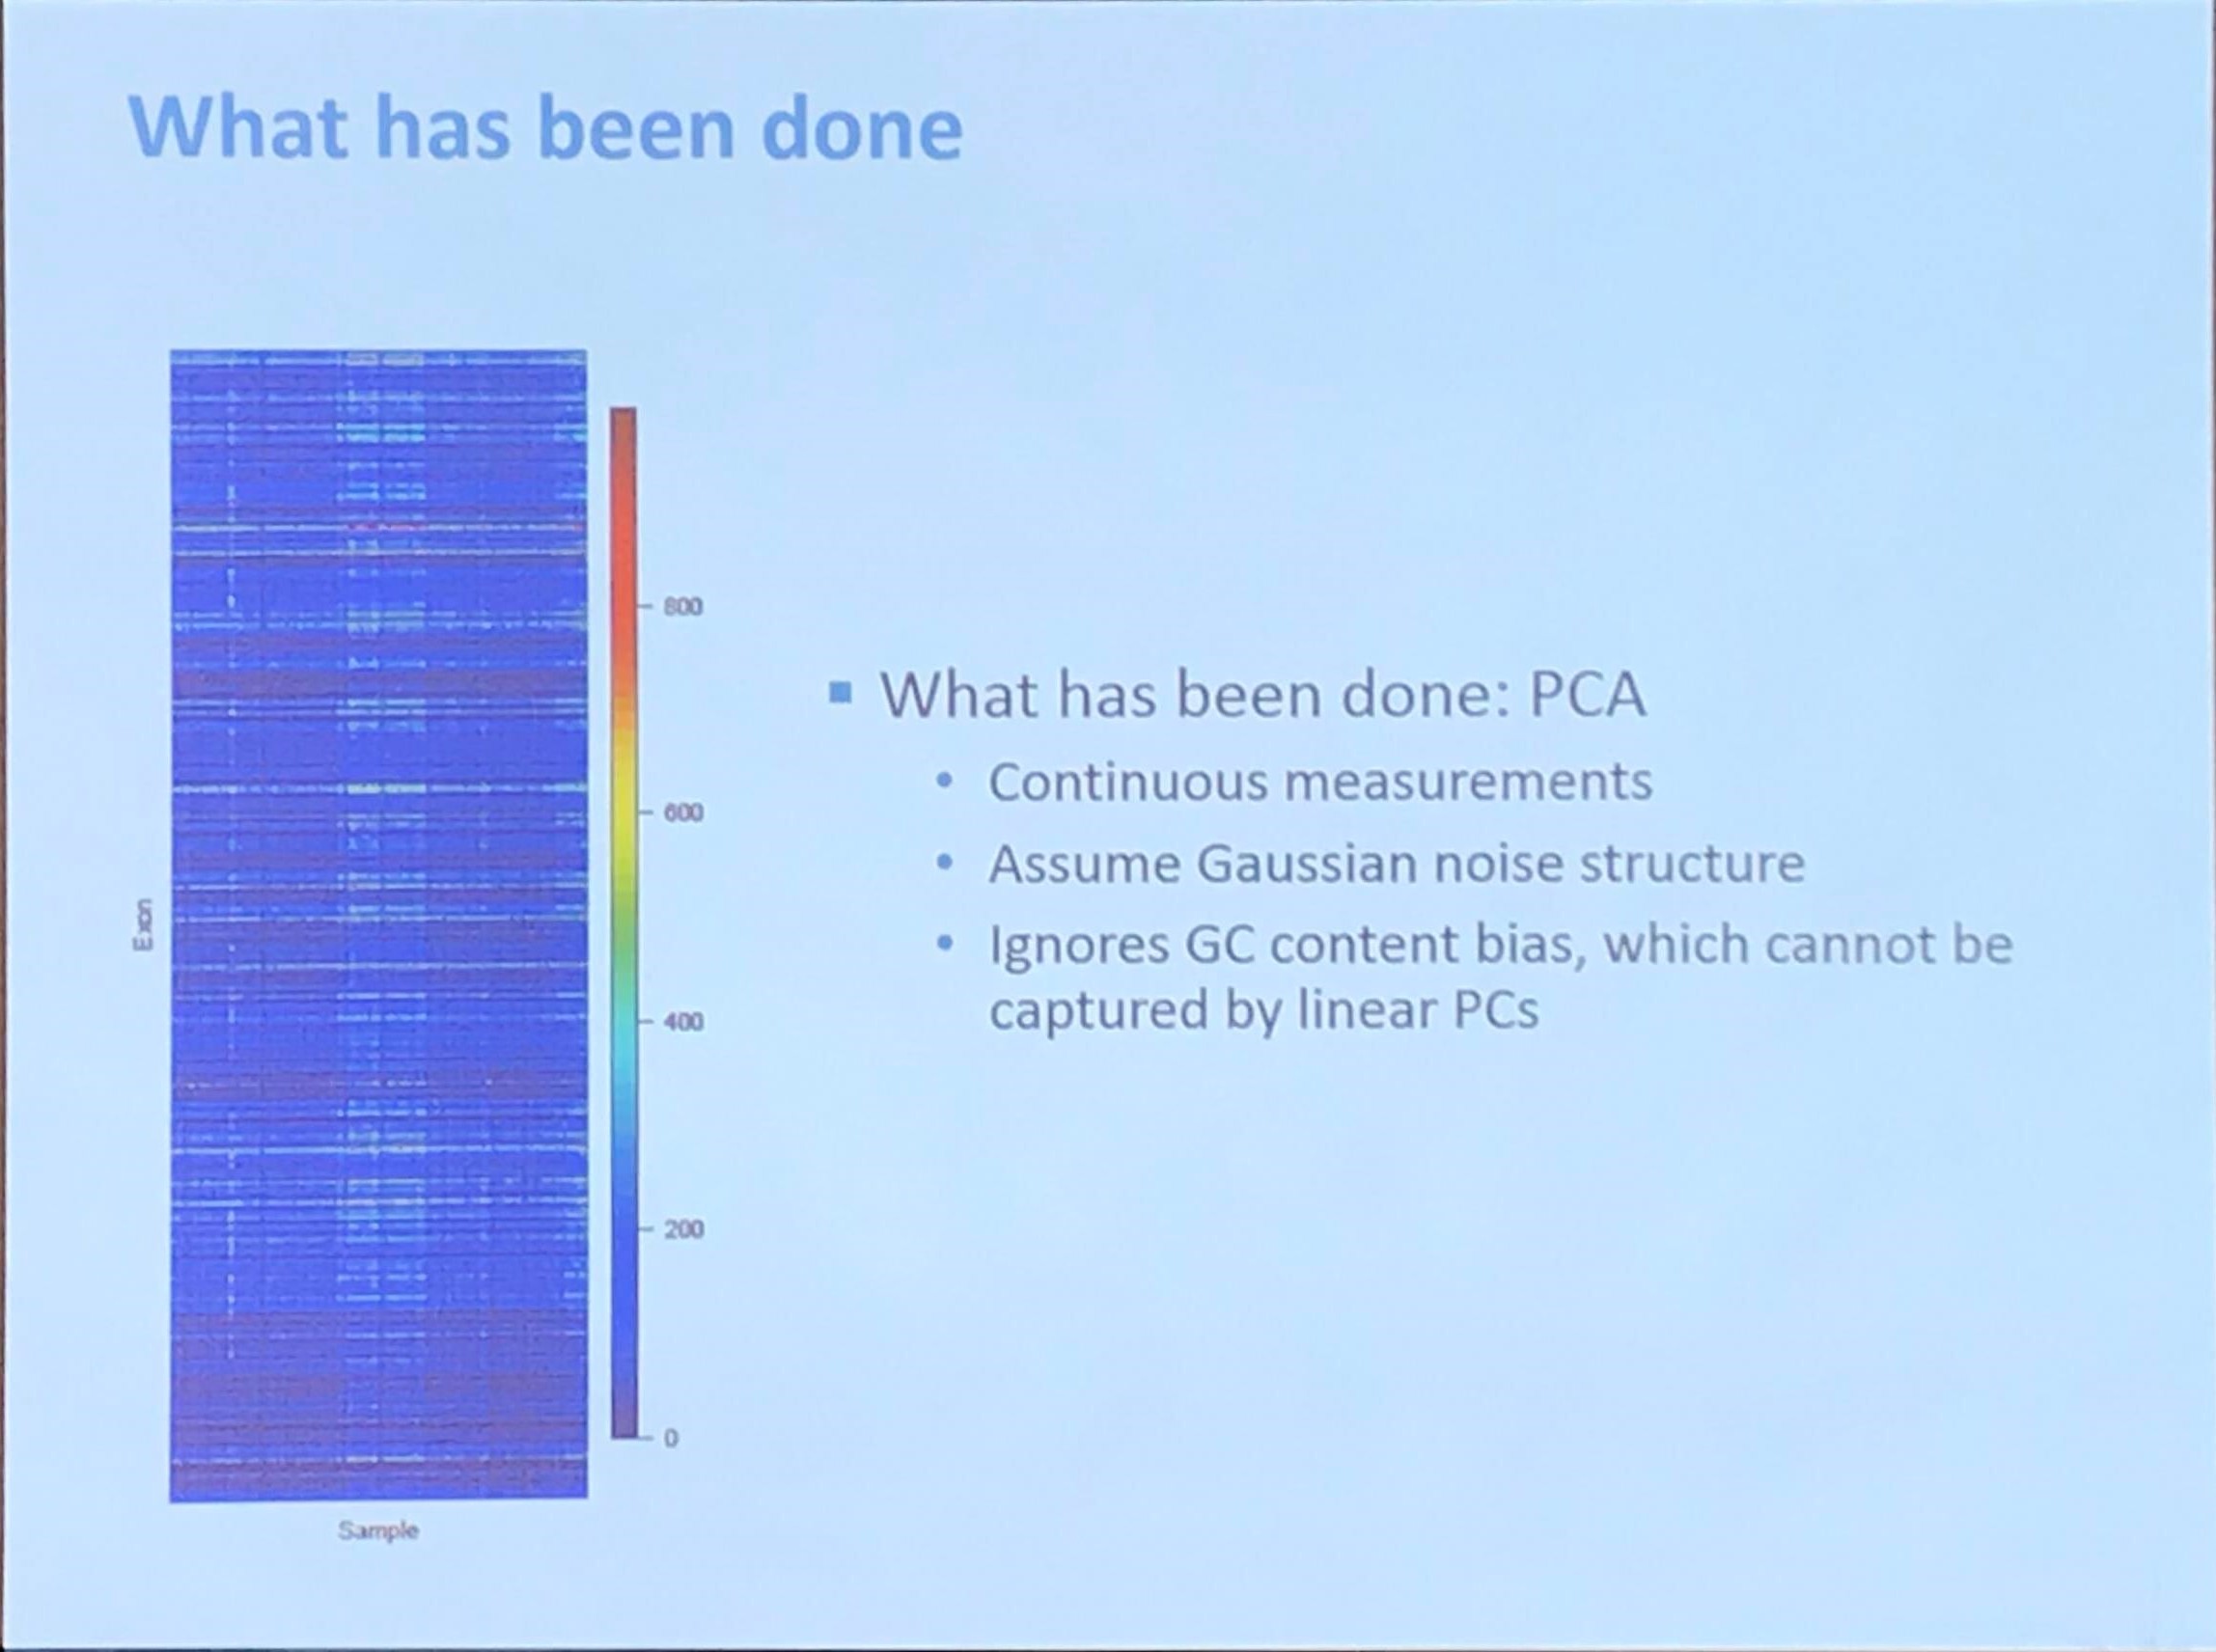
They proposed a method called XHMM, and introduced that
XHMM extracts copy-number signal from noisy read depth by leveraging the large-scale nature of sequencing projects to discern patterns of read-depth biases. Specifically, we ran a principal-component analysis (PCA) on the sample-by-target-depth matrix by “rotating” the high-dimensional data to find the main modes in which depth varies across multiple samples and targets, and we removed the largest of such effects.
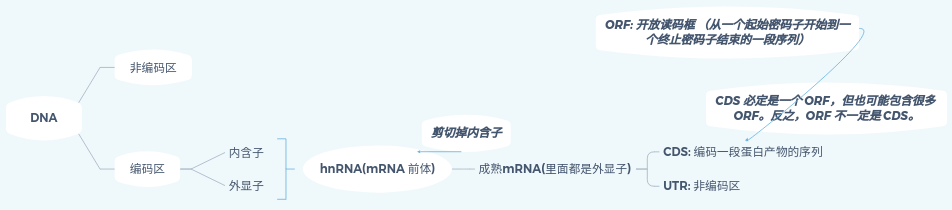
Here is a diagram illustrating some basic concepts of DNA, which adapted from 潘高的小站 – 外显子、内含子、mRNA、CDS、ORF的区别与联系
GC content bias
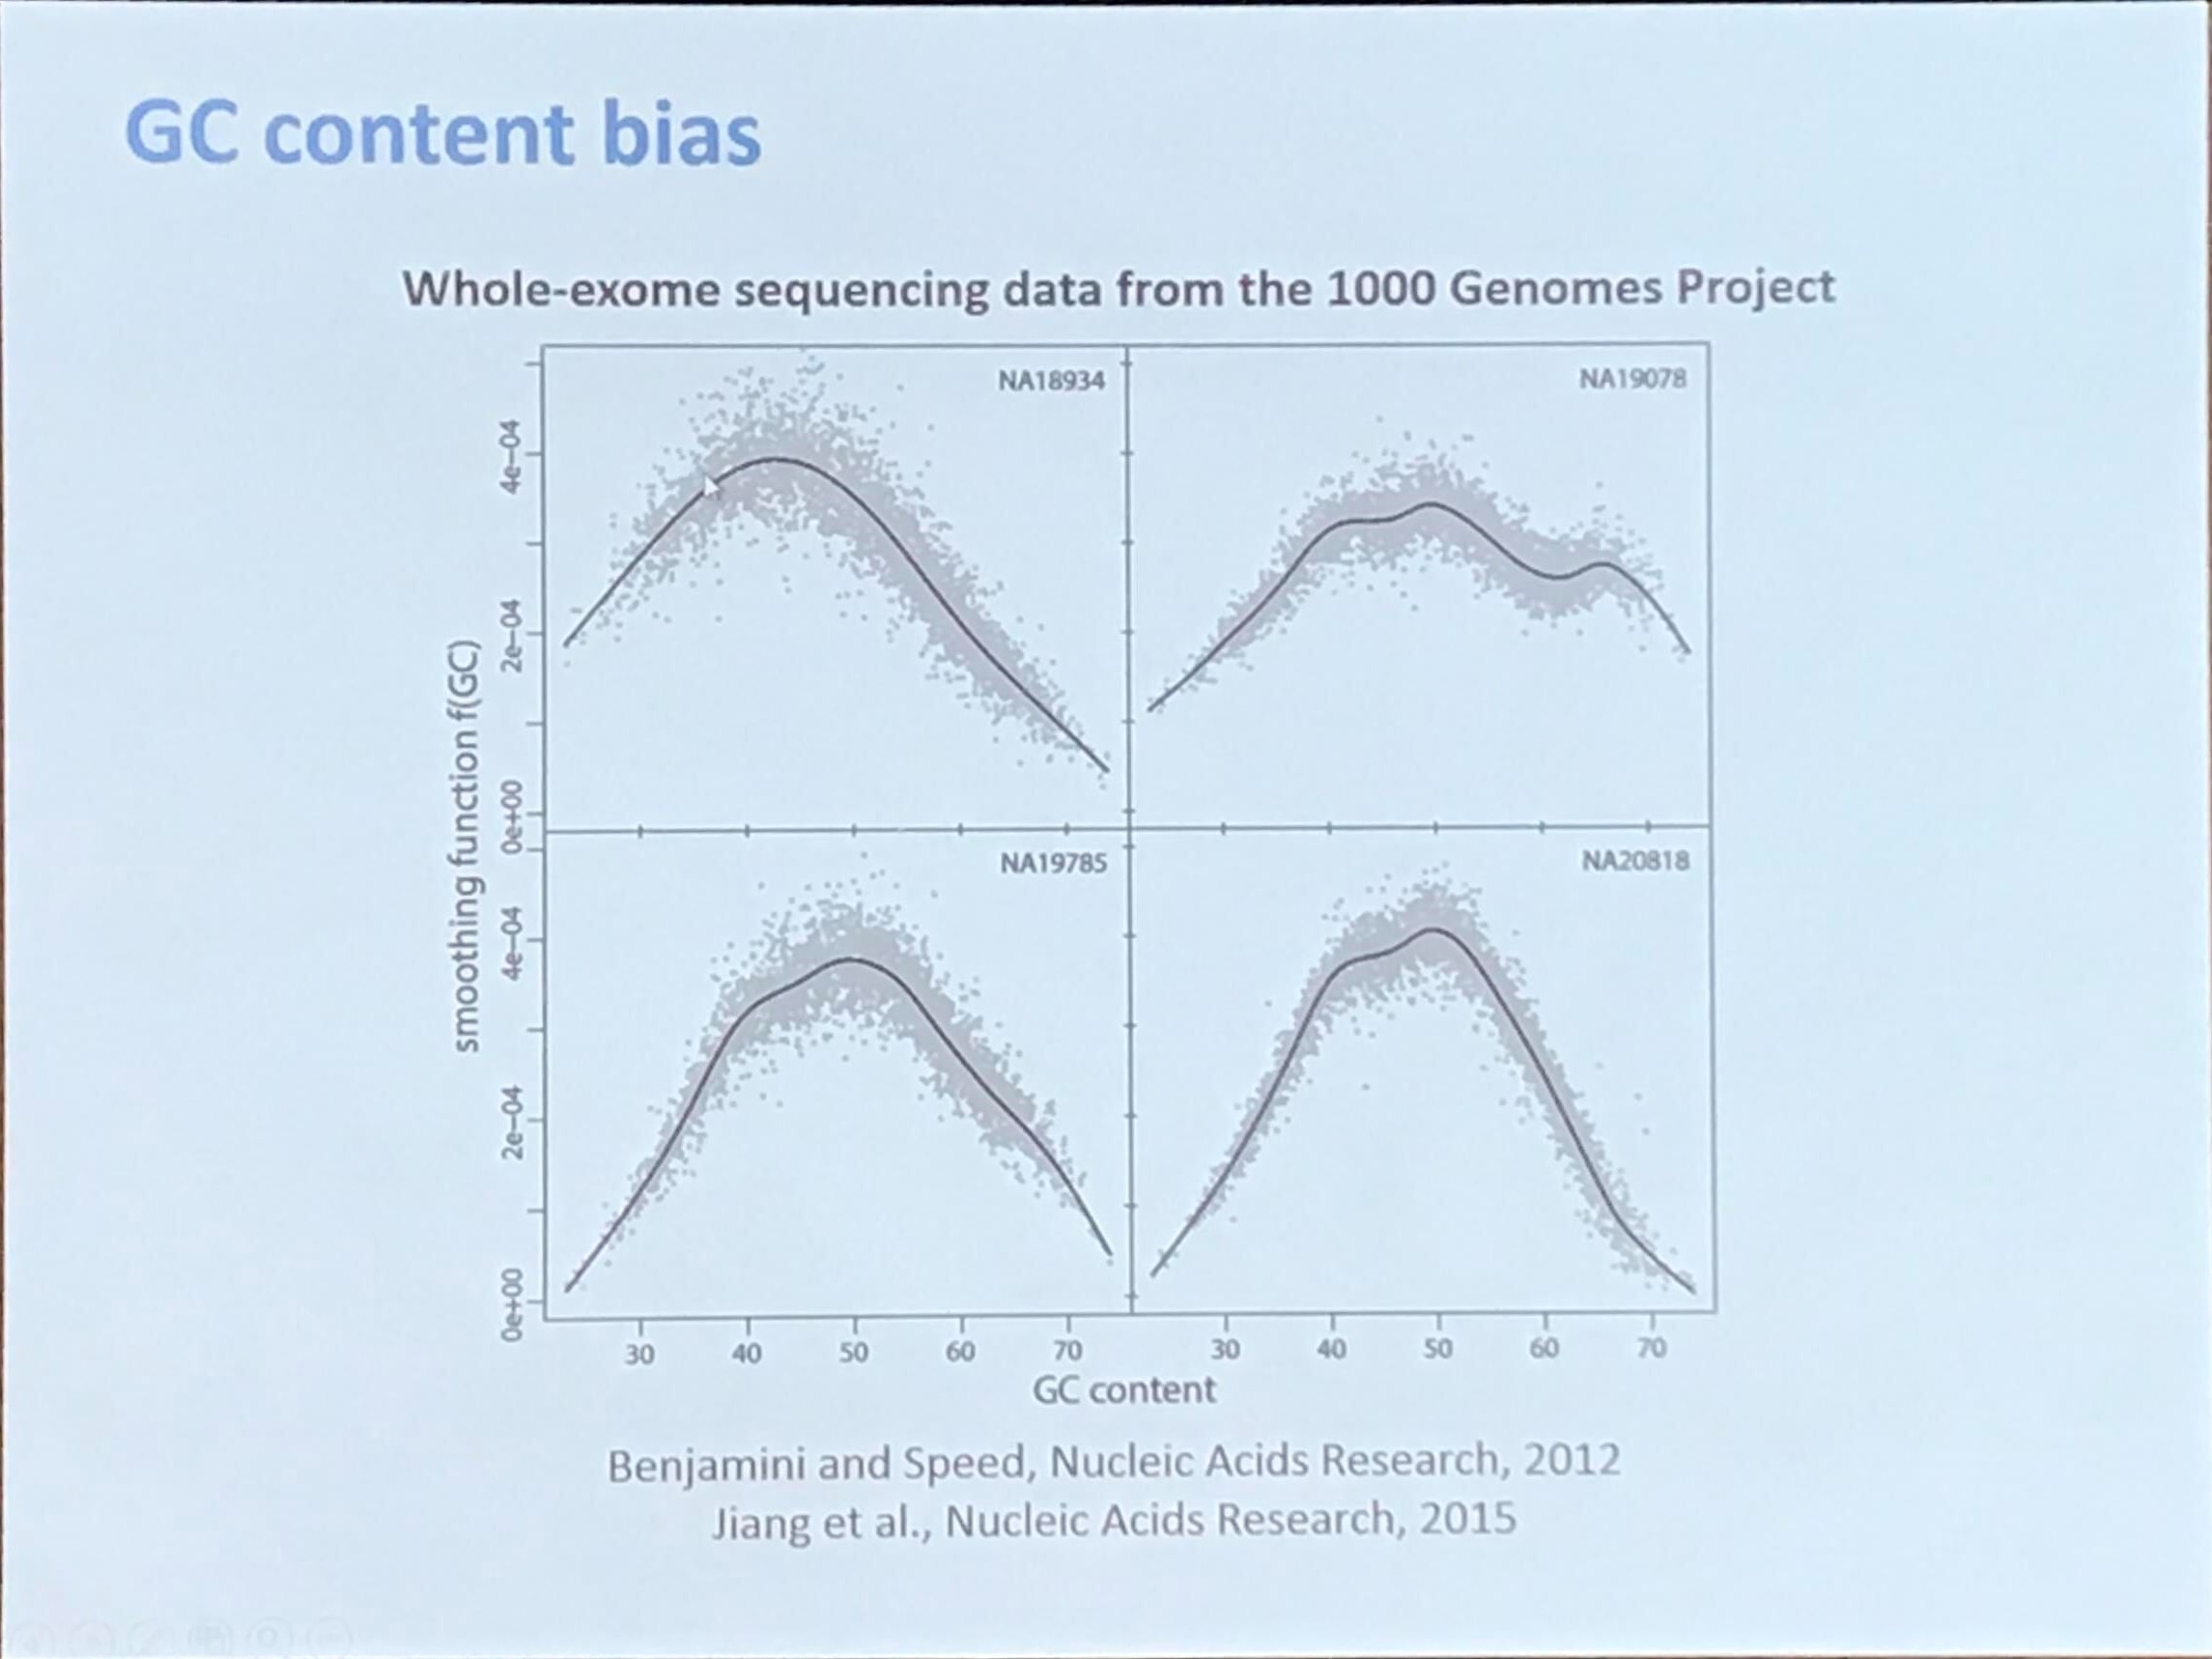
GC content is calculated as
\[\frac{G+C}{A+G+C+T}\times 100\%\,.\]The theoretical distribution would be a Normal distribution (refer to 小L生信学习日记-4丨原始数据质量如何判断?-下).
Poisson latent factor model for normalization
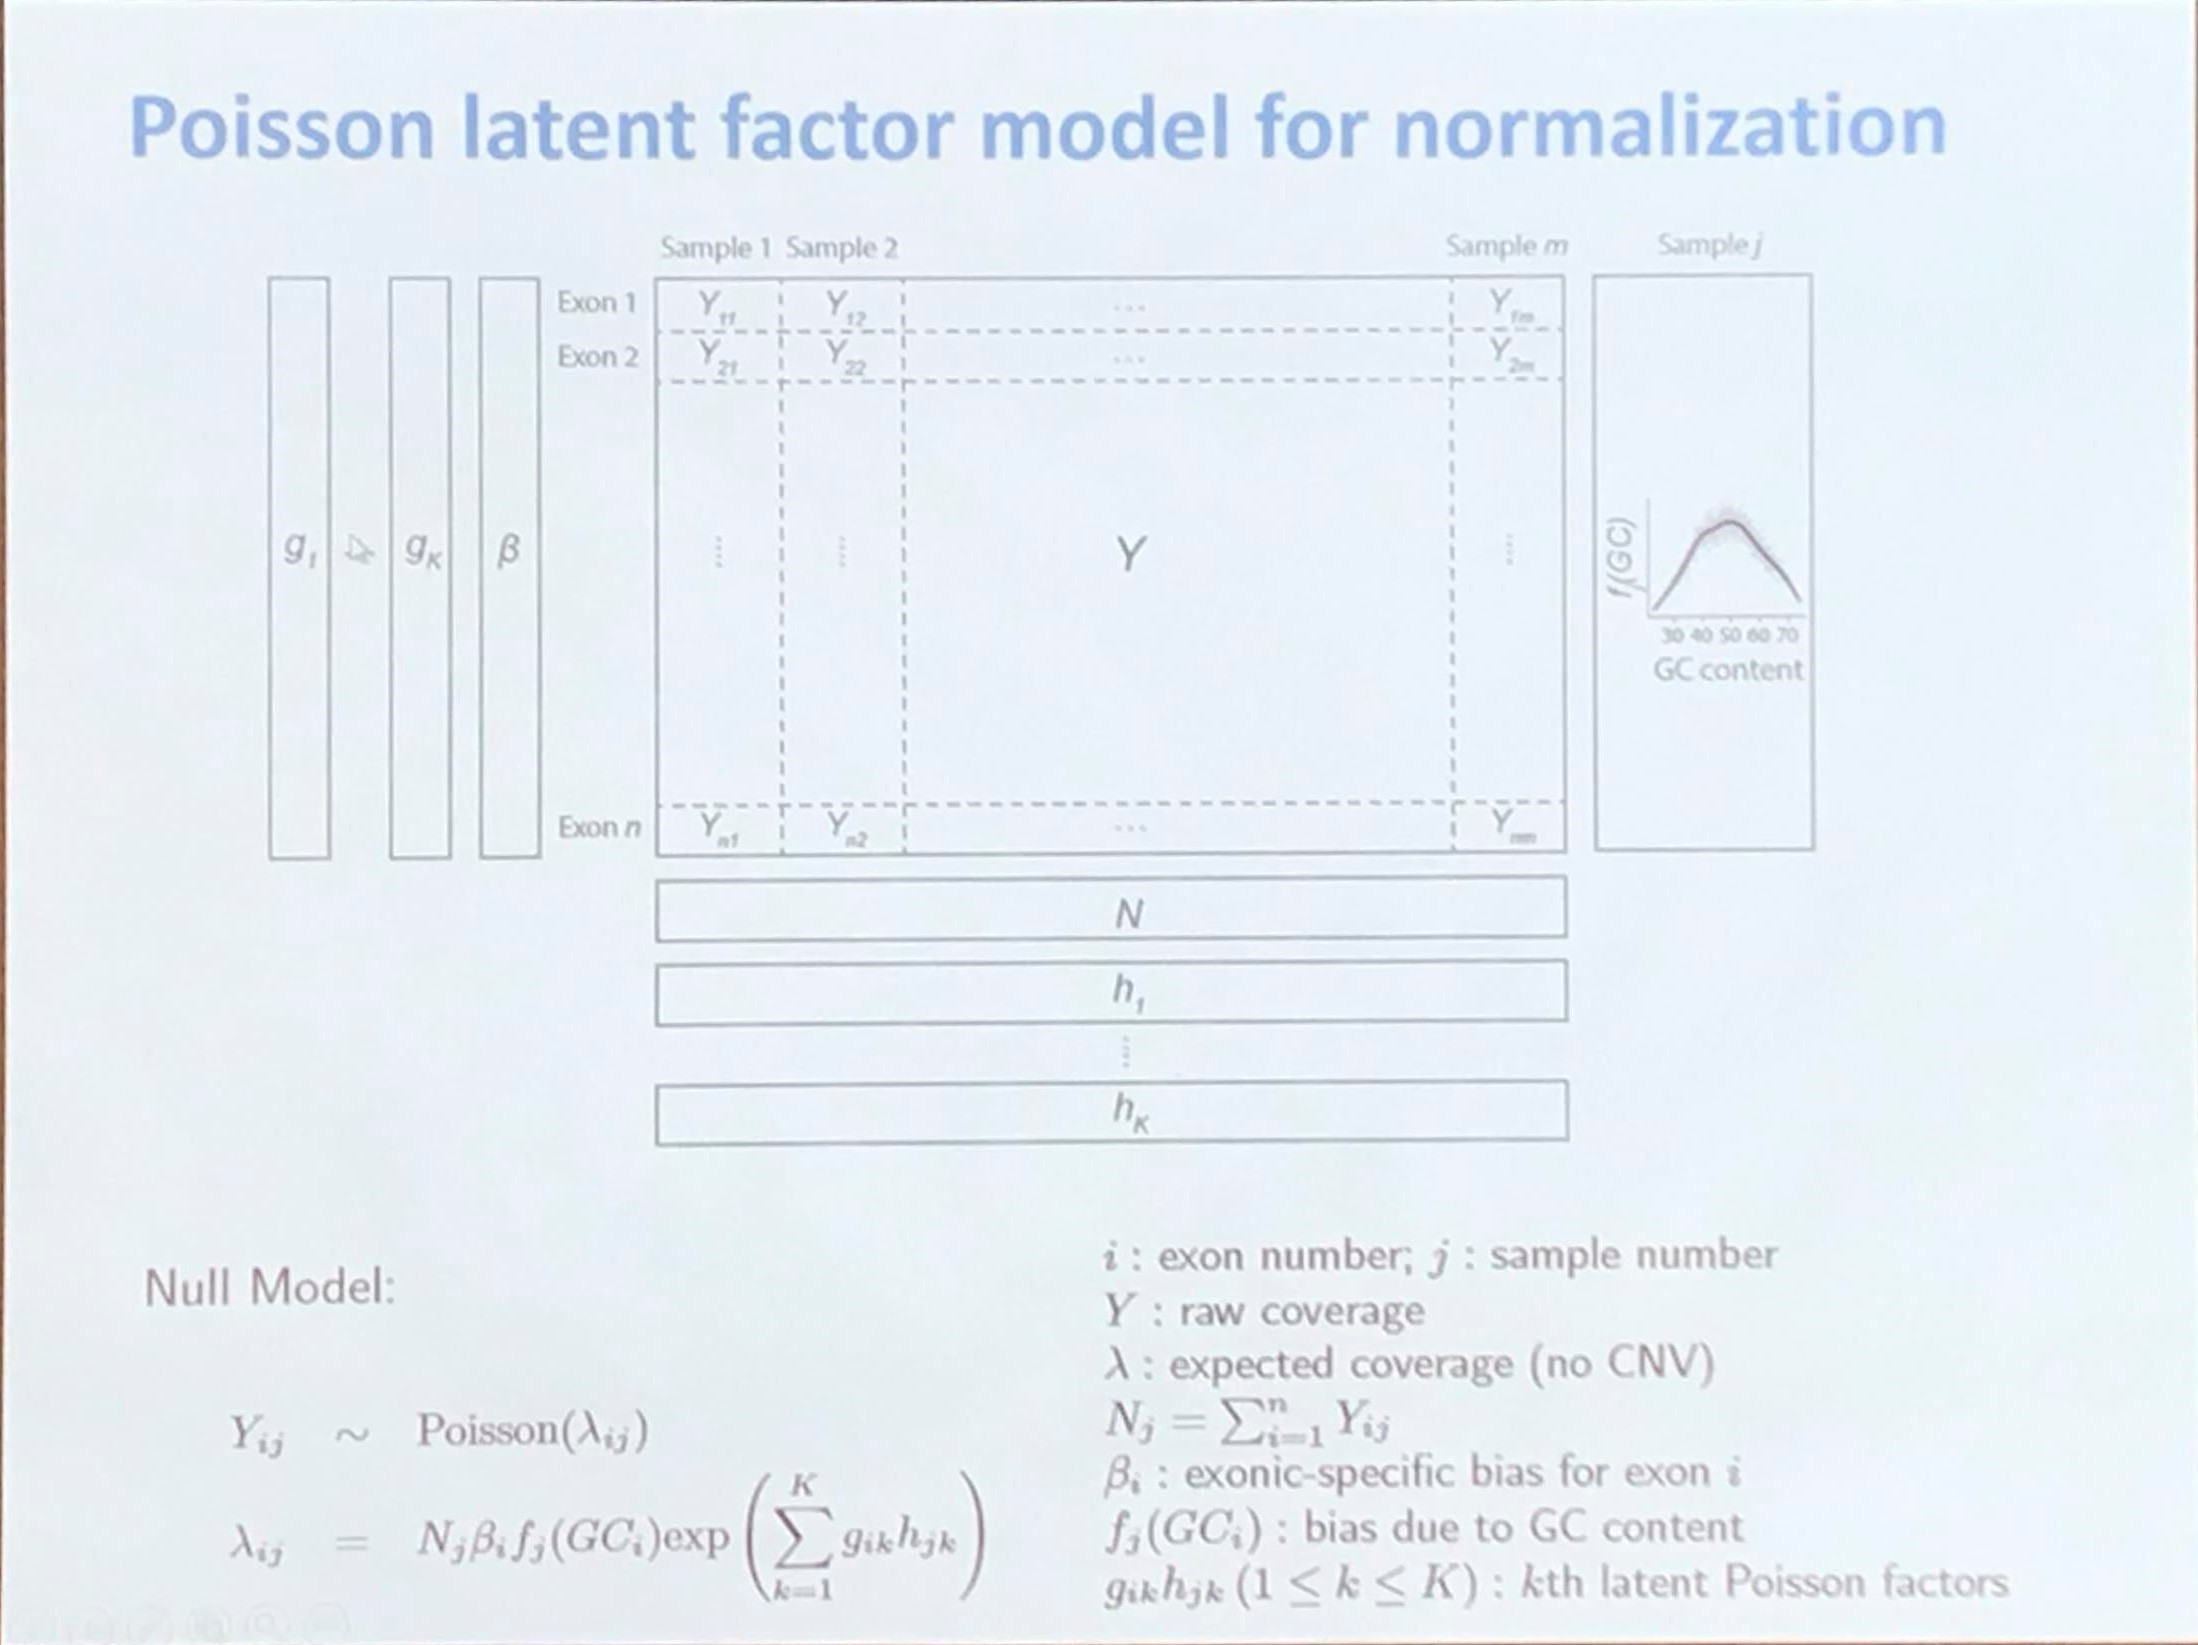
CODEX: COpy number Detection by EXome-seq
source: https://github.com/yuchaojiang/CODEX
paper: CODEX: a normalization and copy number variation detection method for whole exome sequencing
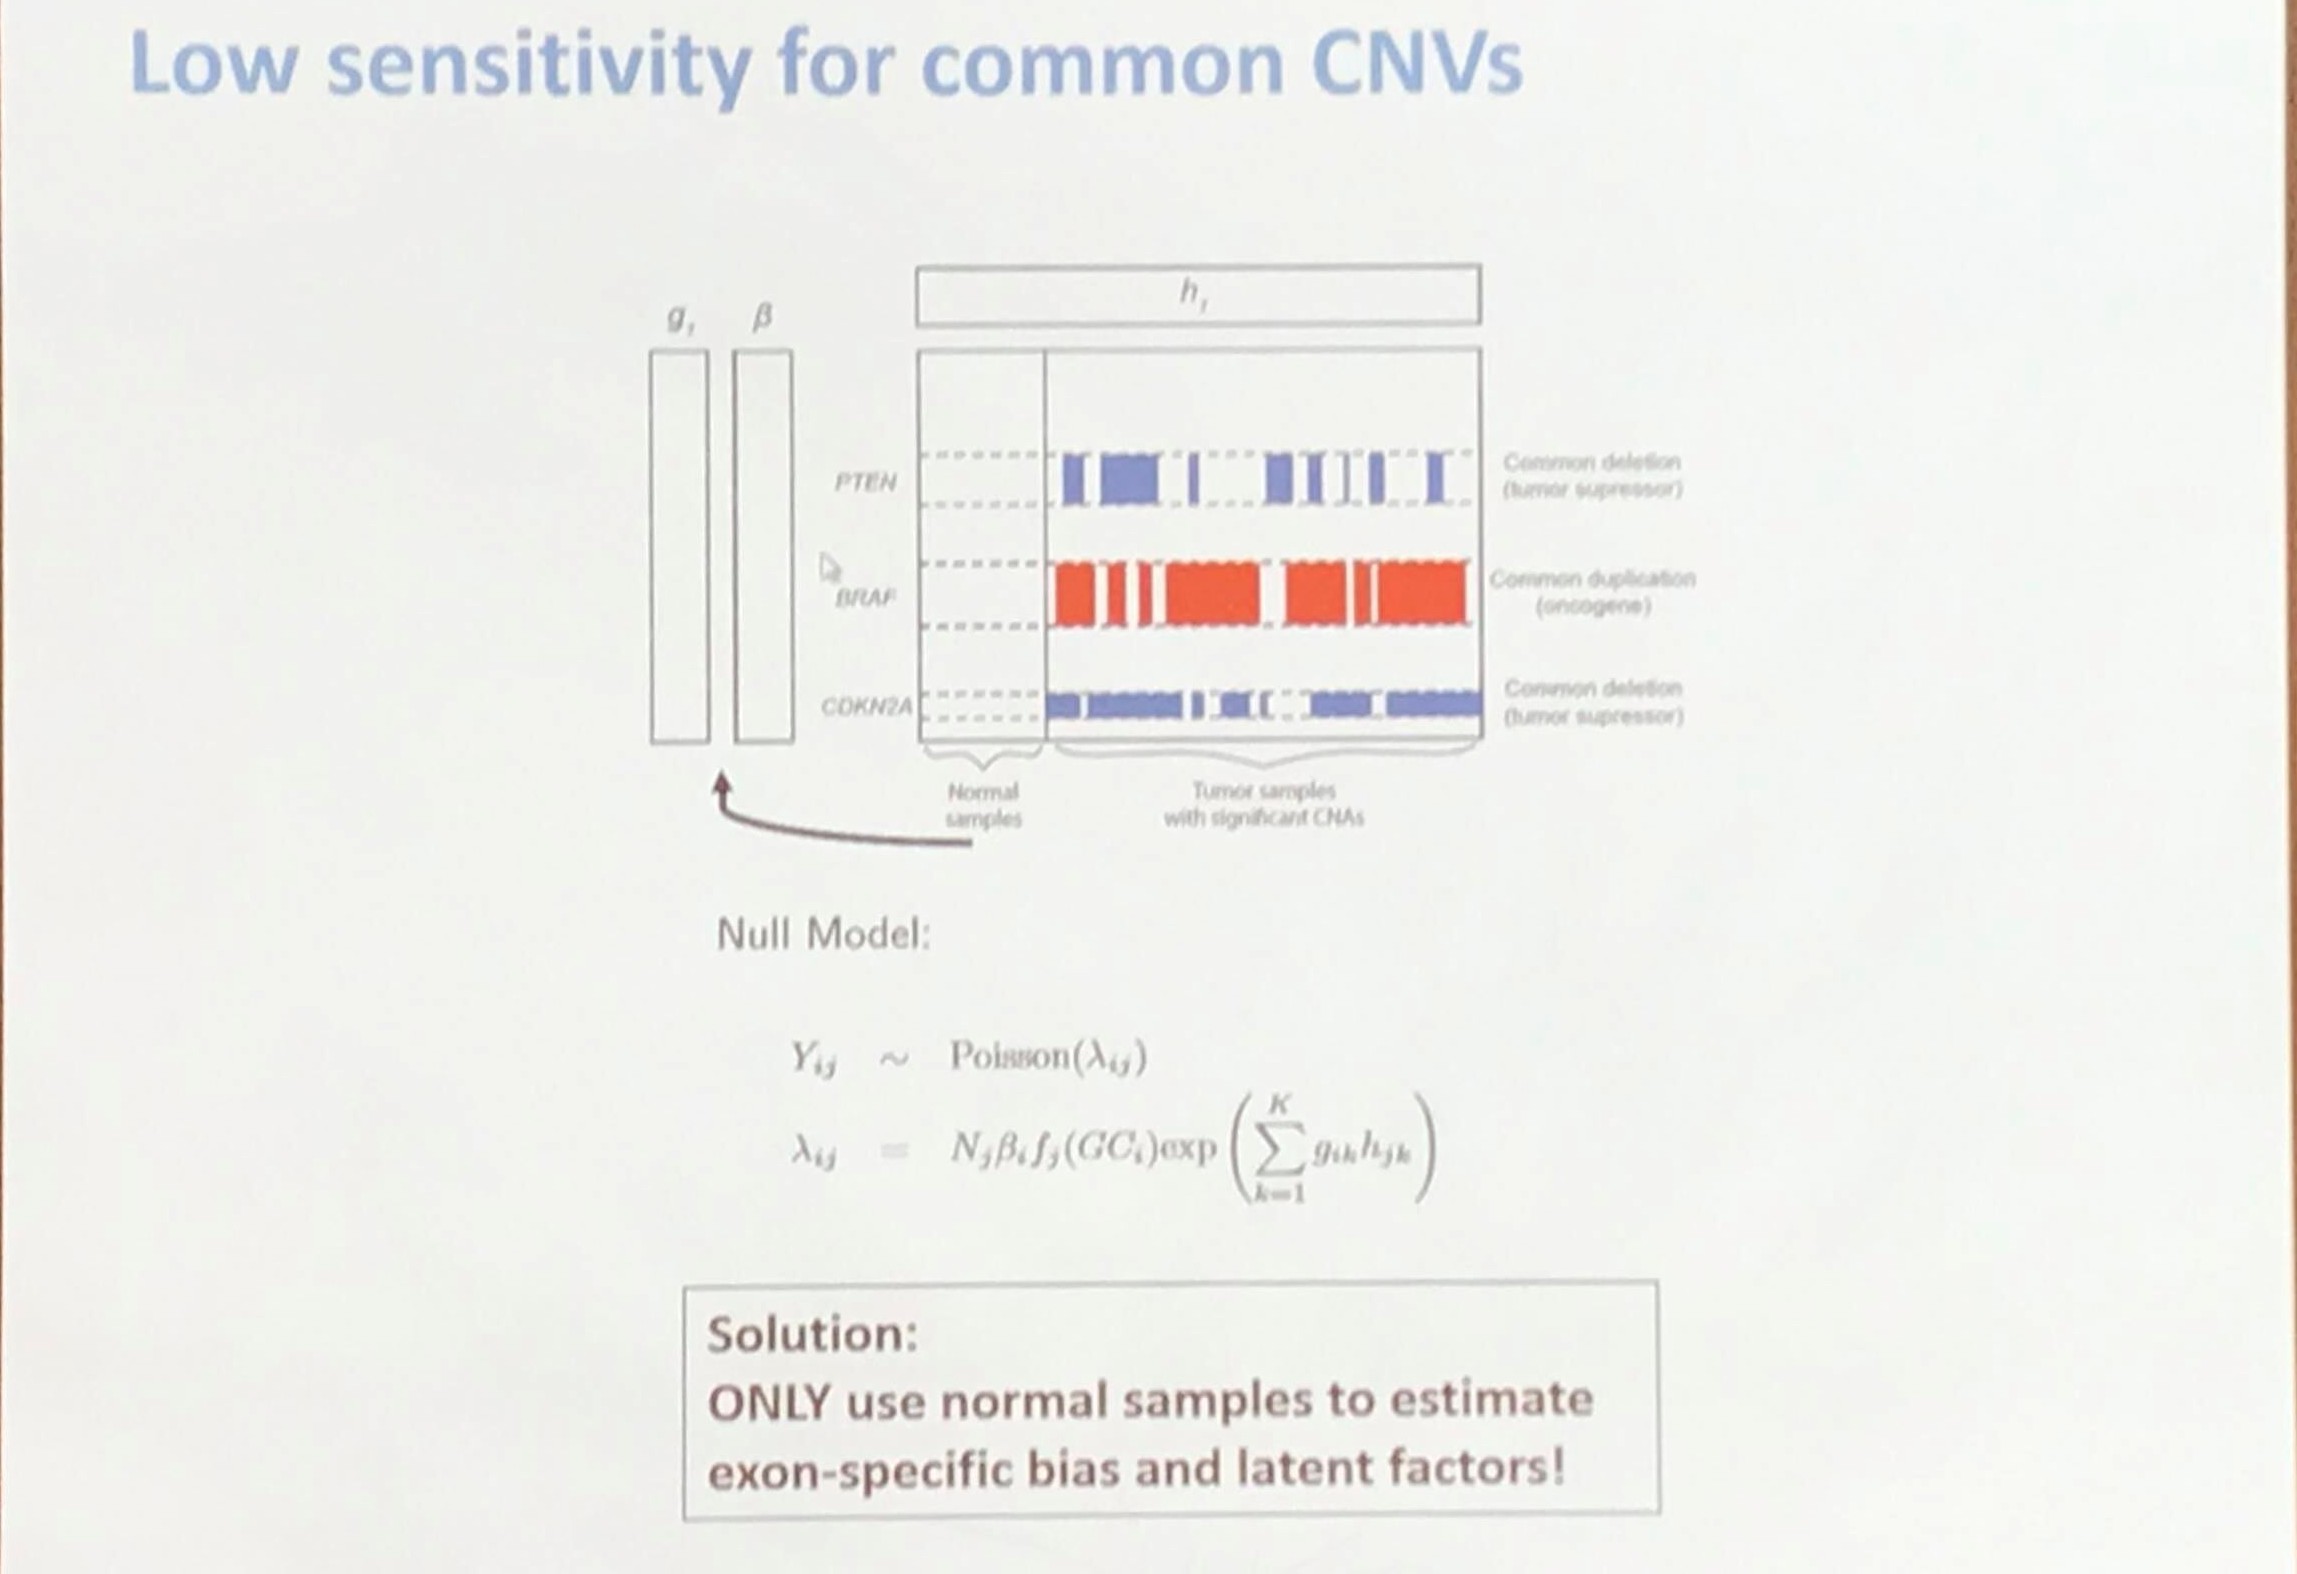
Lower sensitivity for common CNVs
The speaker mentioned that the common CNV signals are attenuated by the Poisson latent factors, and he proposed the following solution.
CODEX2: full-spectrum CNV detection by NGS
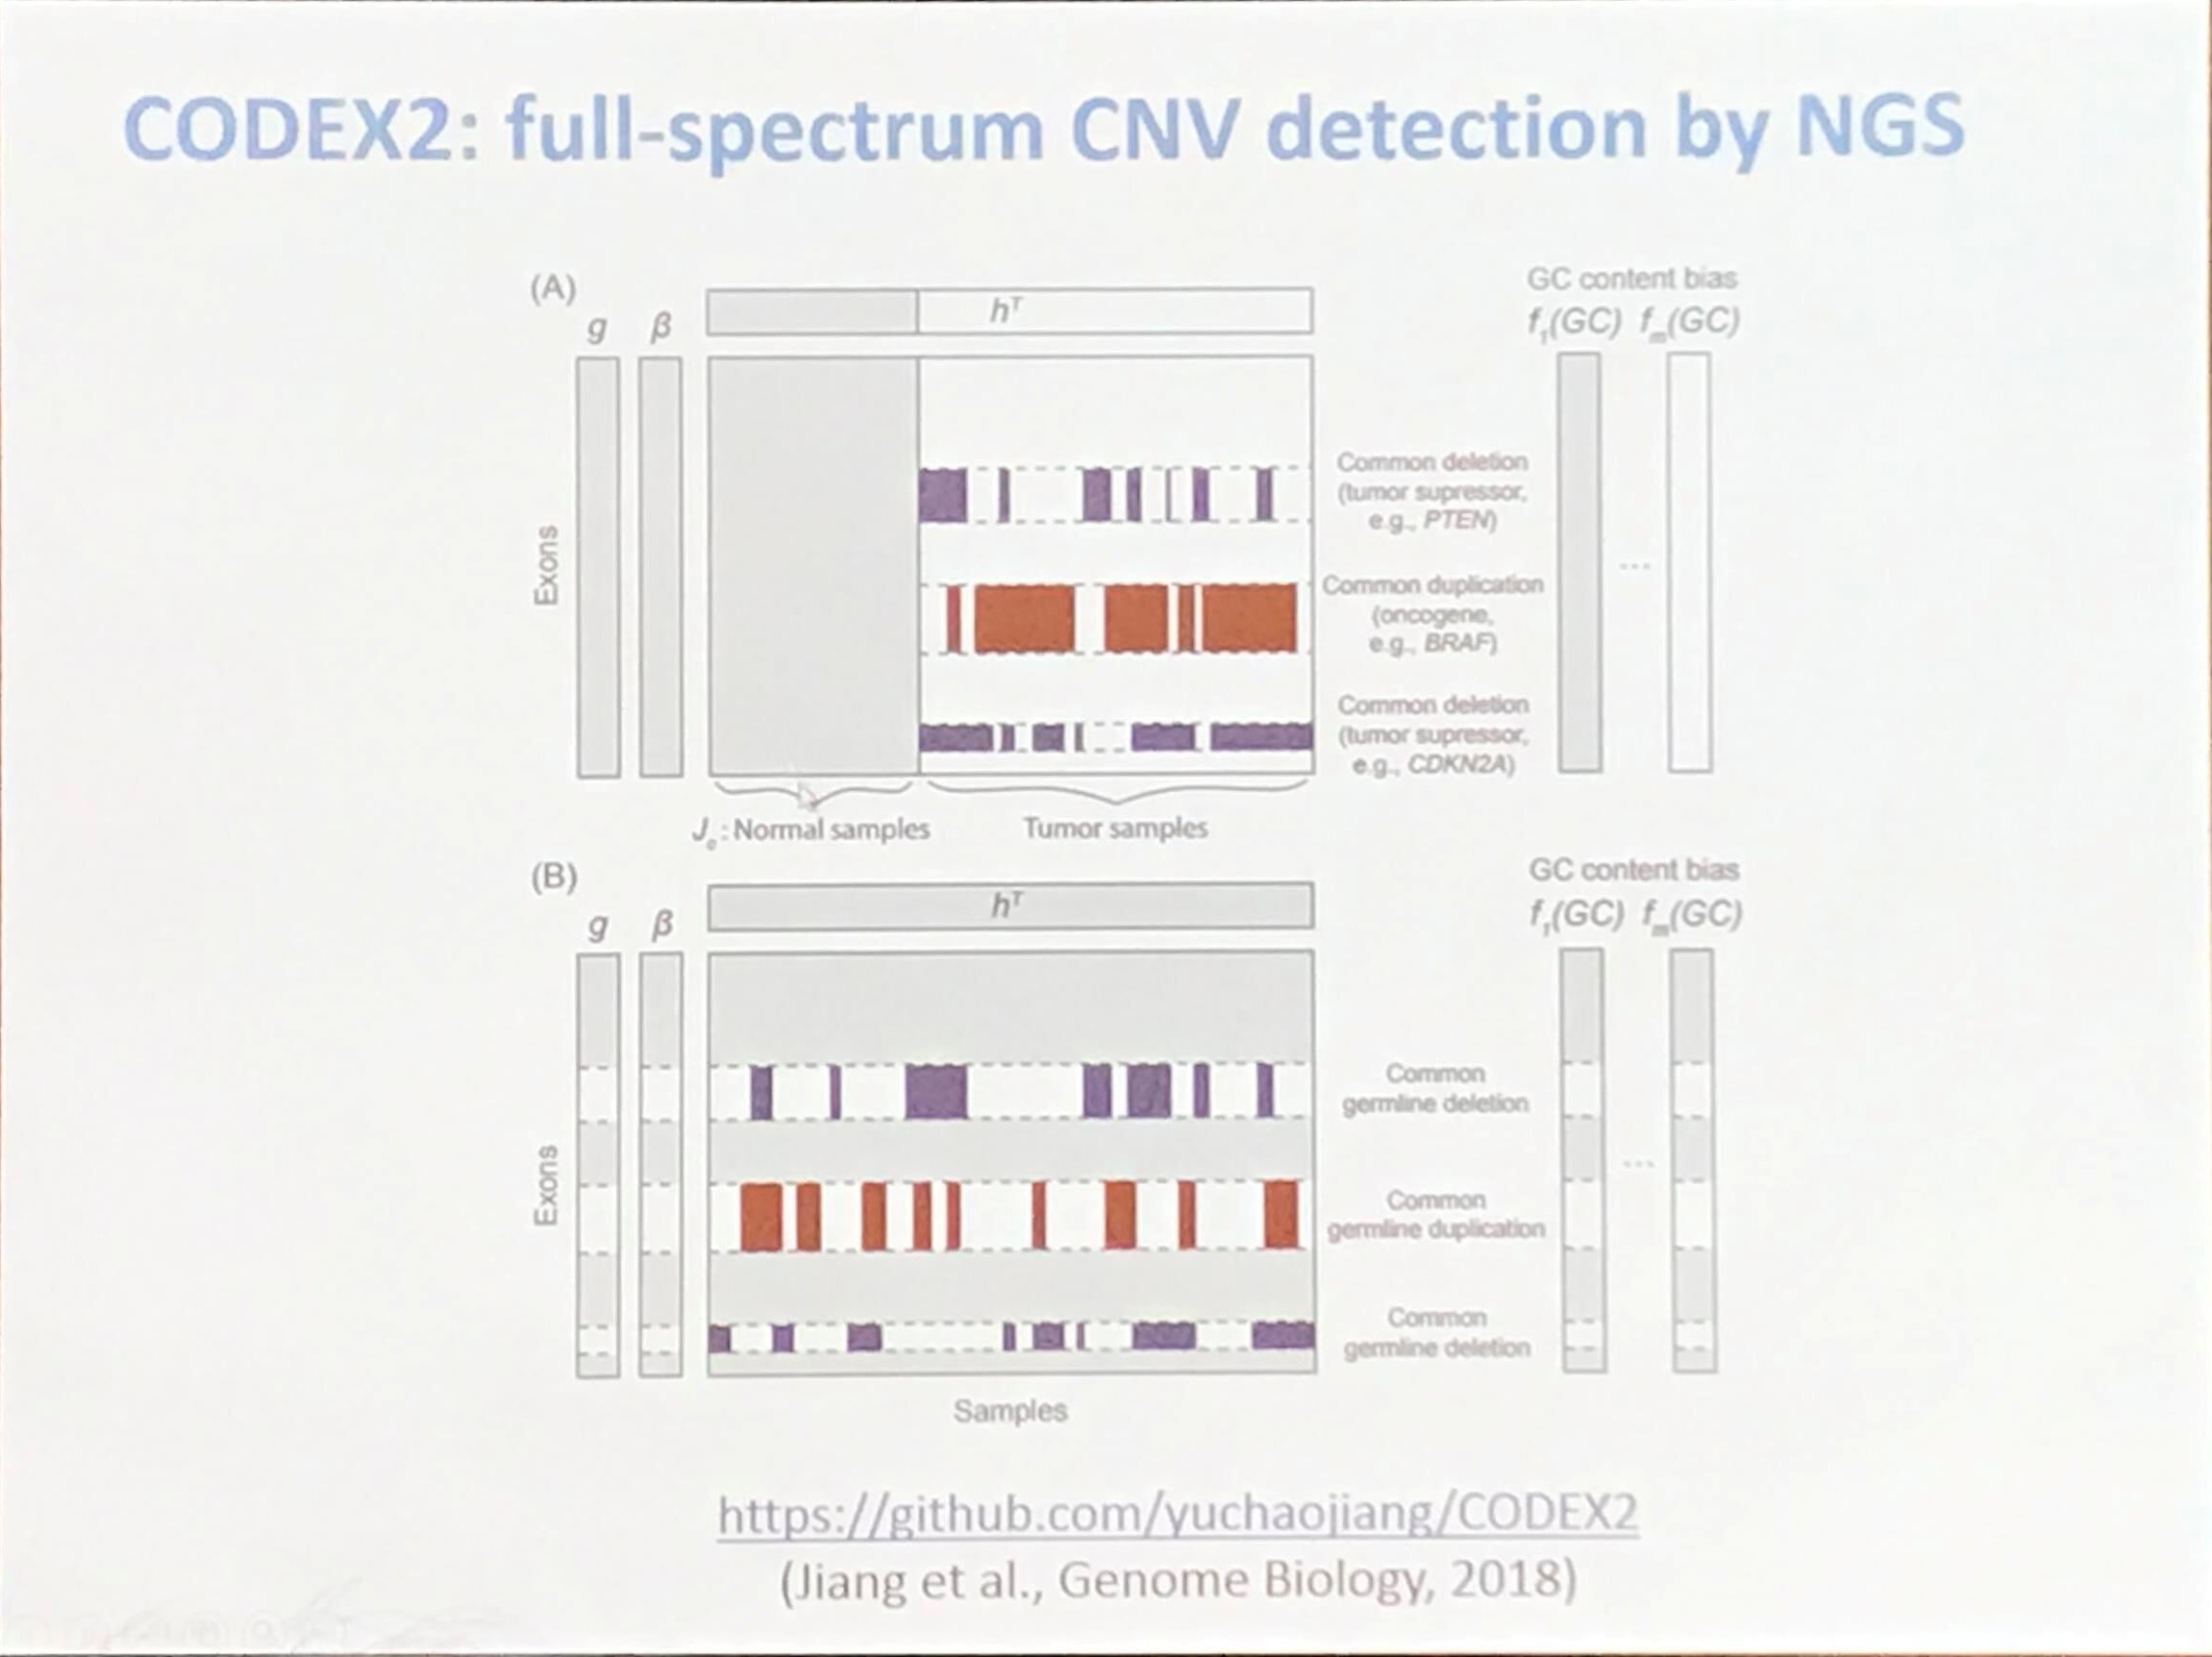
source: https://github.com/yuchaojiang/CODEX2
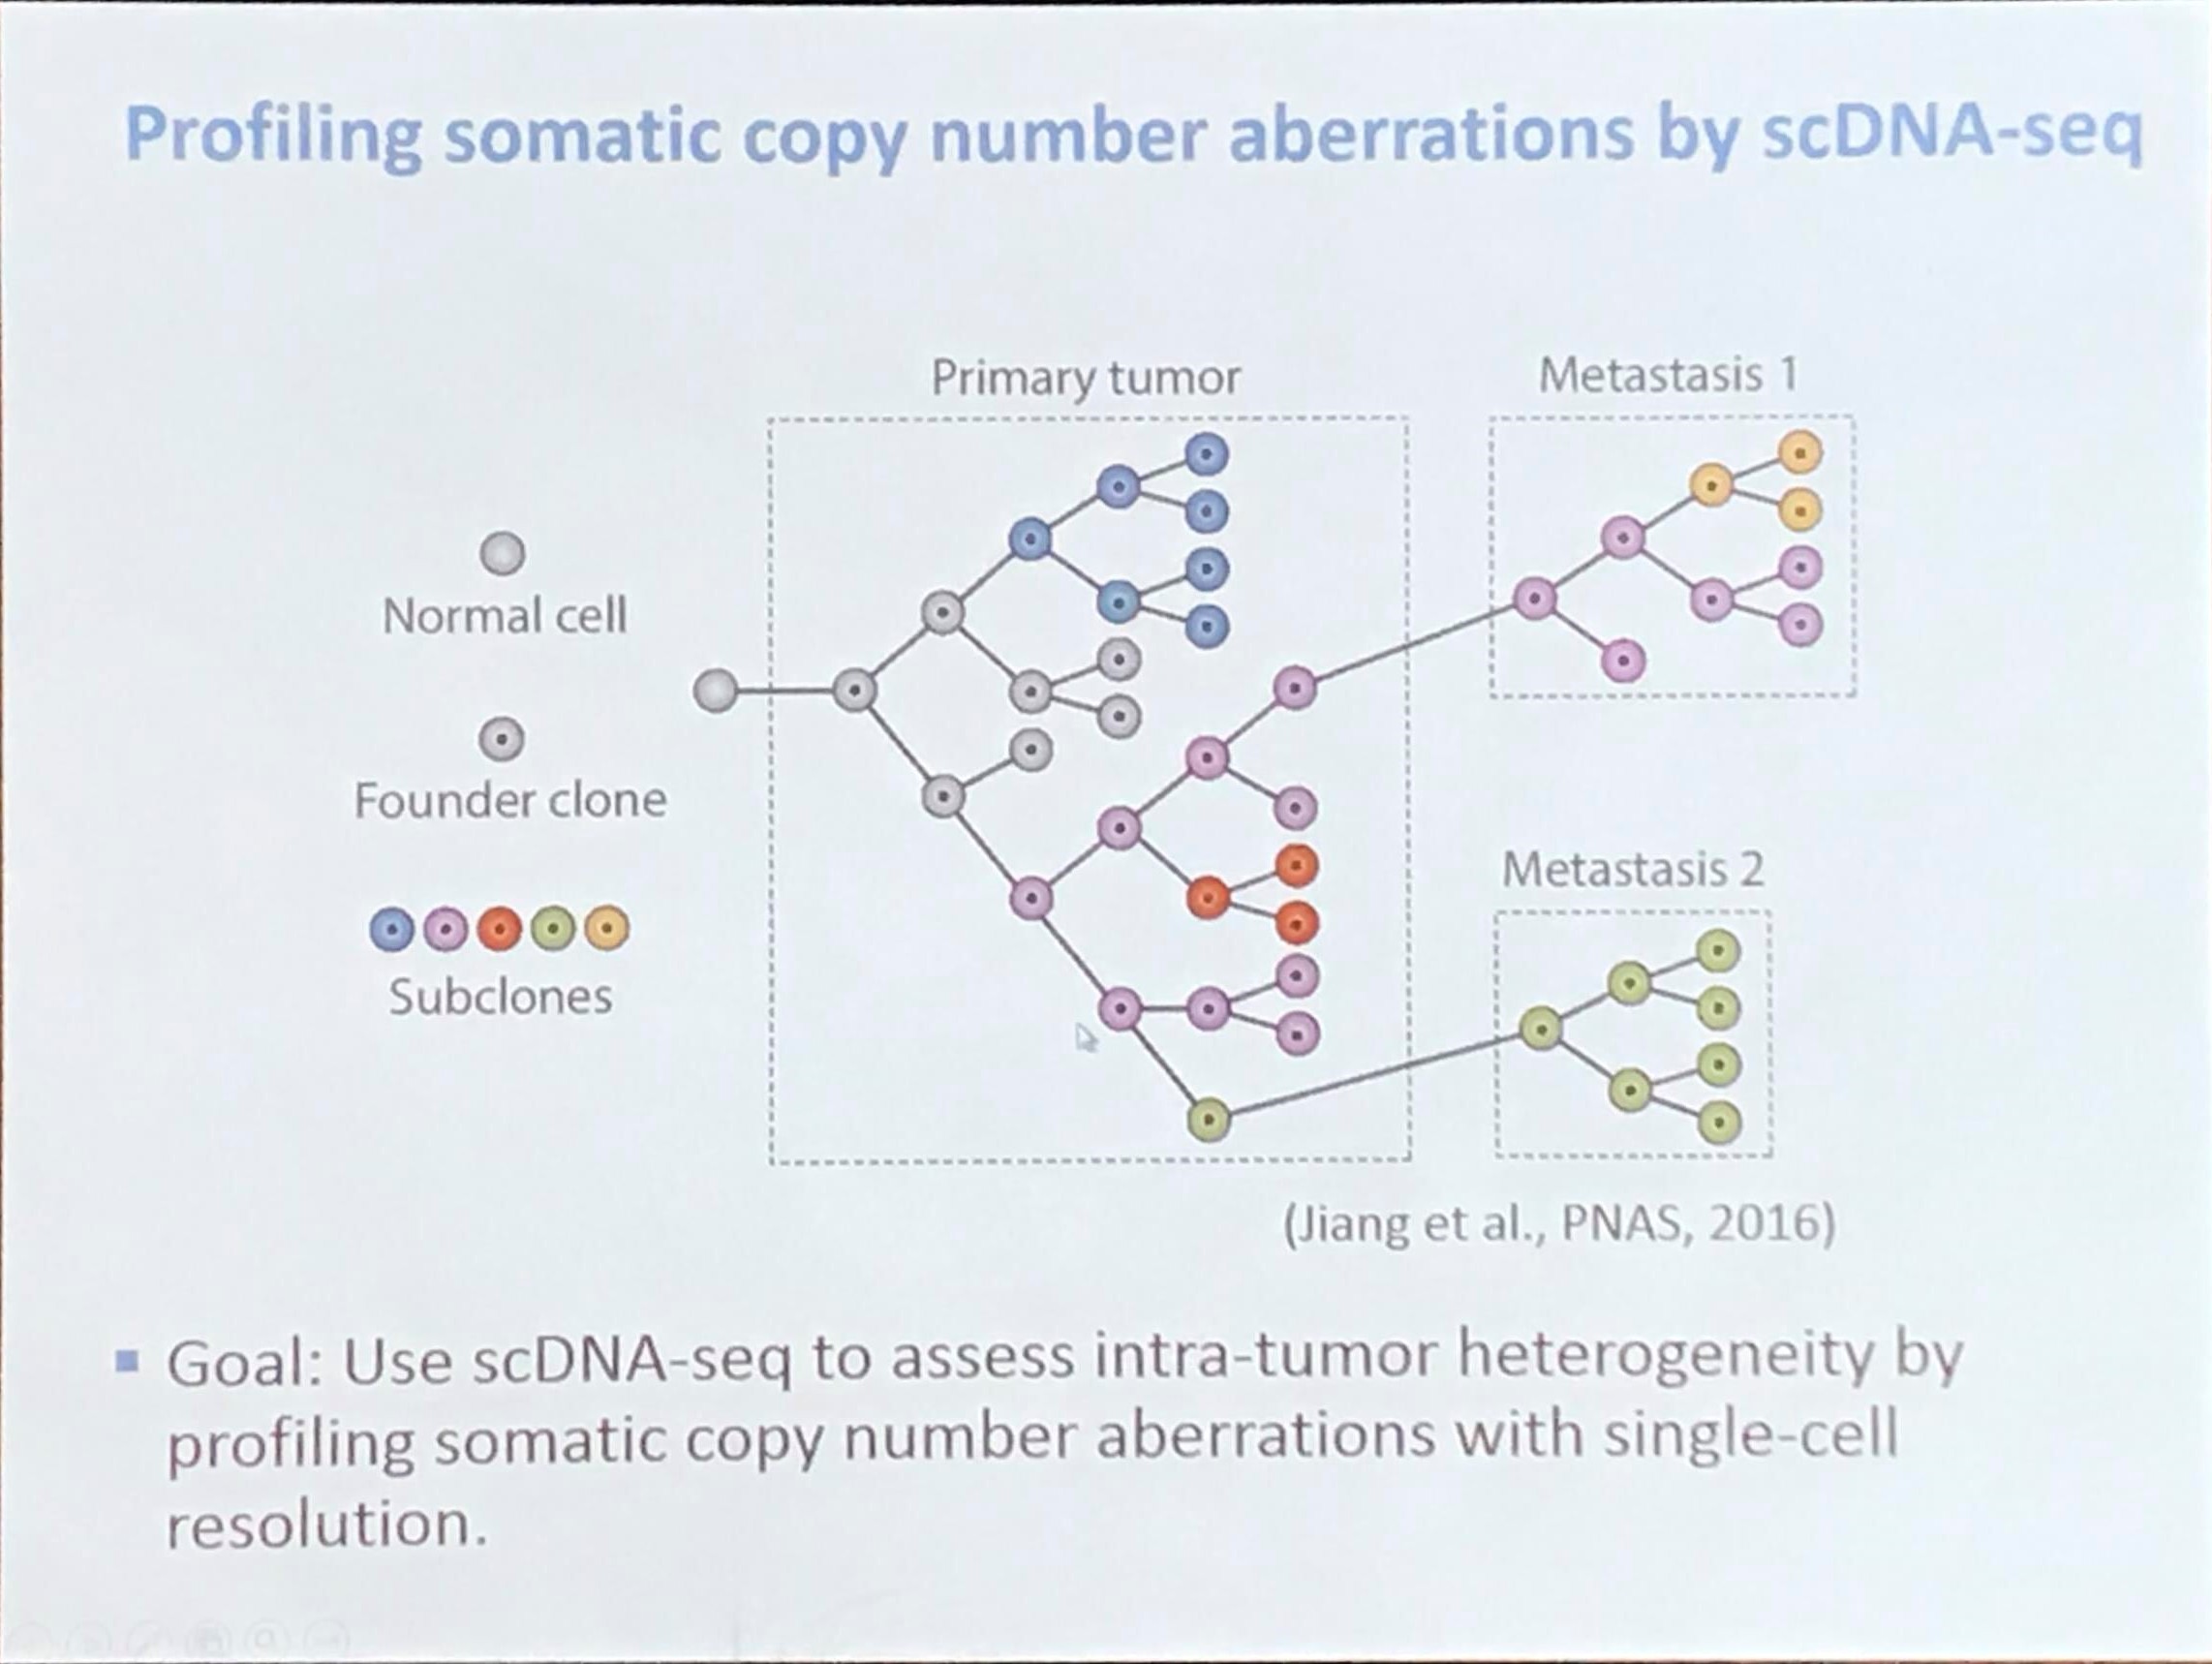
Profiling somatic copy number aberrations by scDNA-seq
As for the difference of somatic mutations and germline mutations,
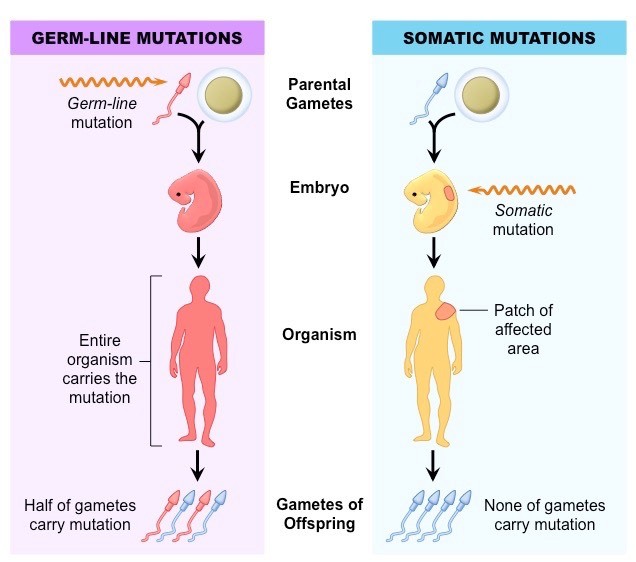
refer to somatic和germline突变有什么区别,问什么在研究癌症的过程中要区分这两种突变?
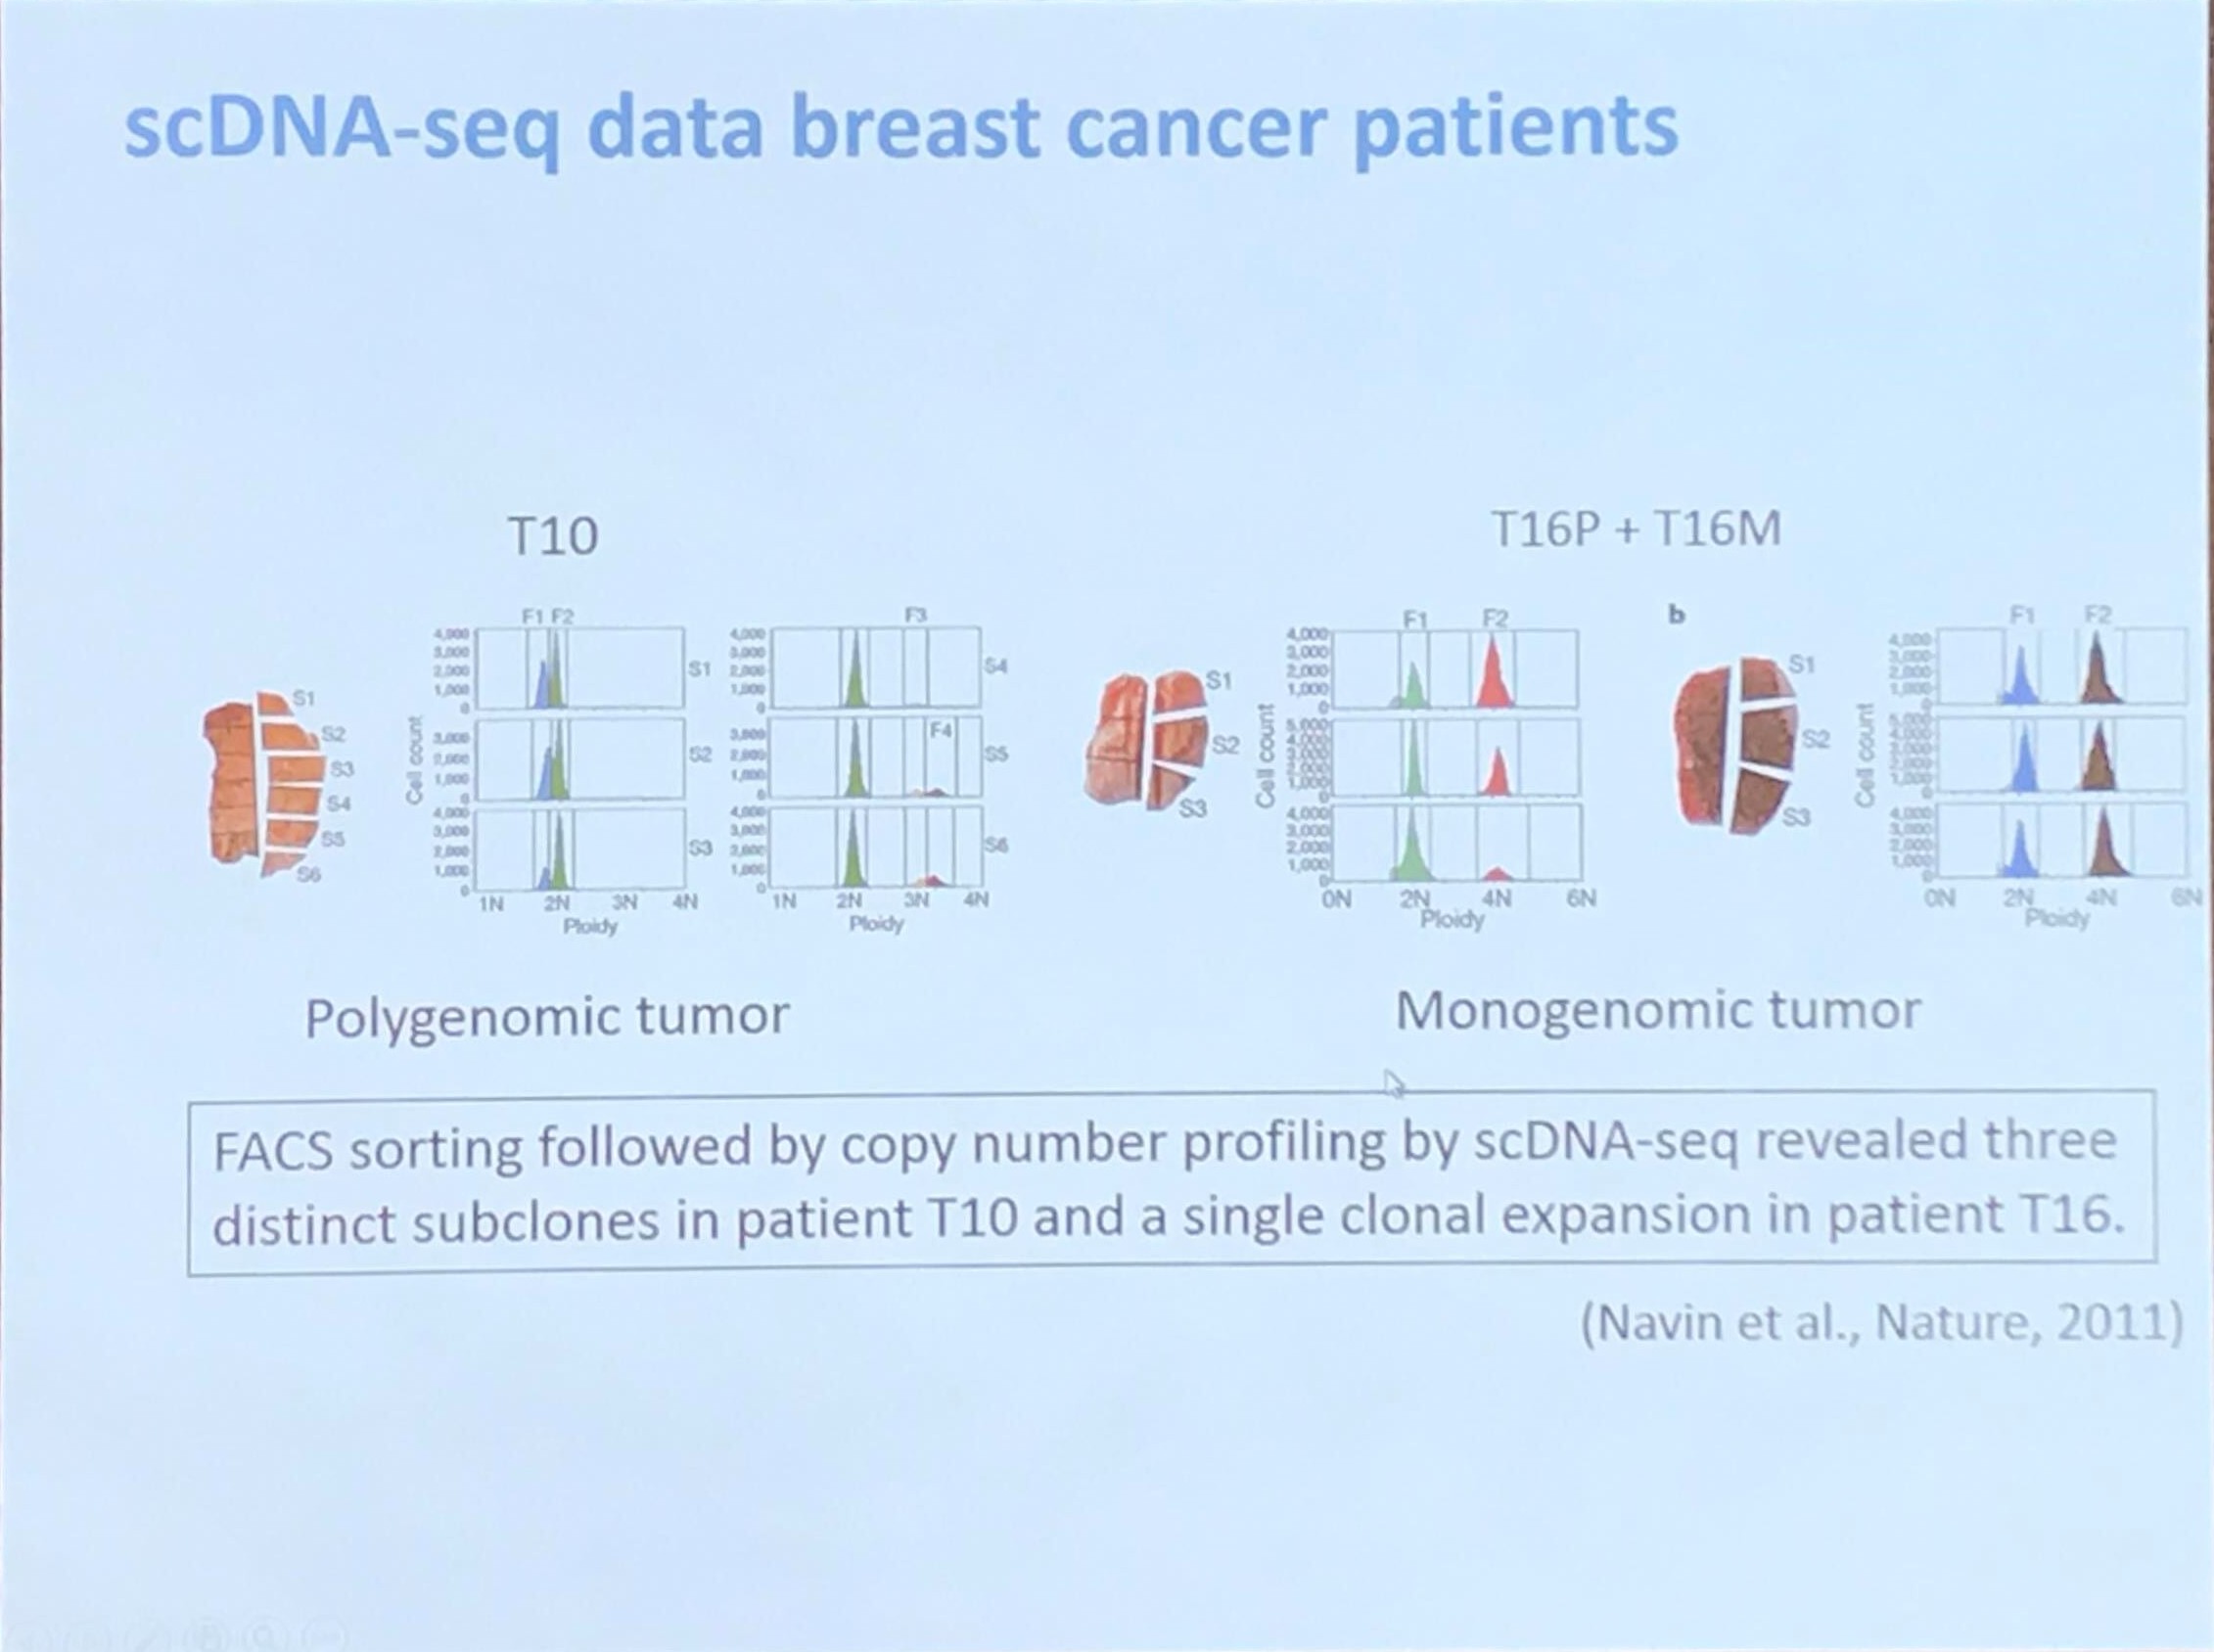
scDNA-seq data breast cancer patients
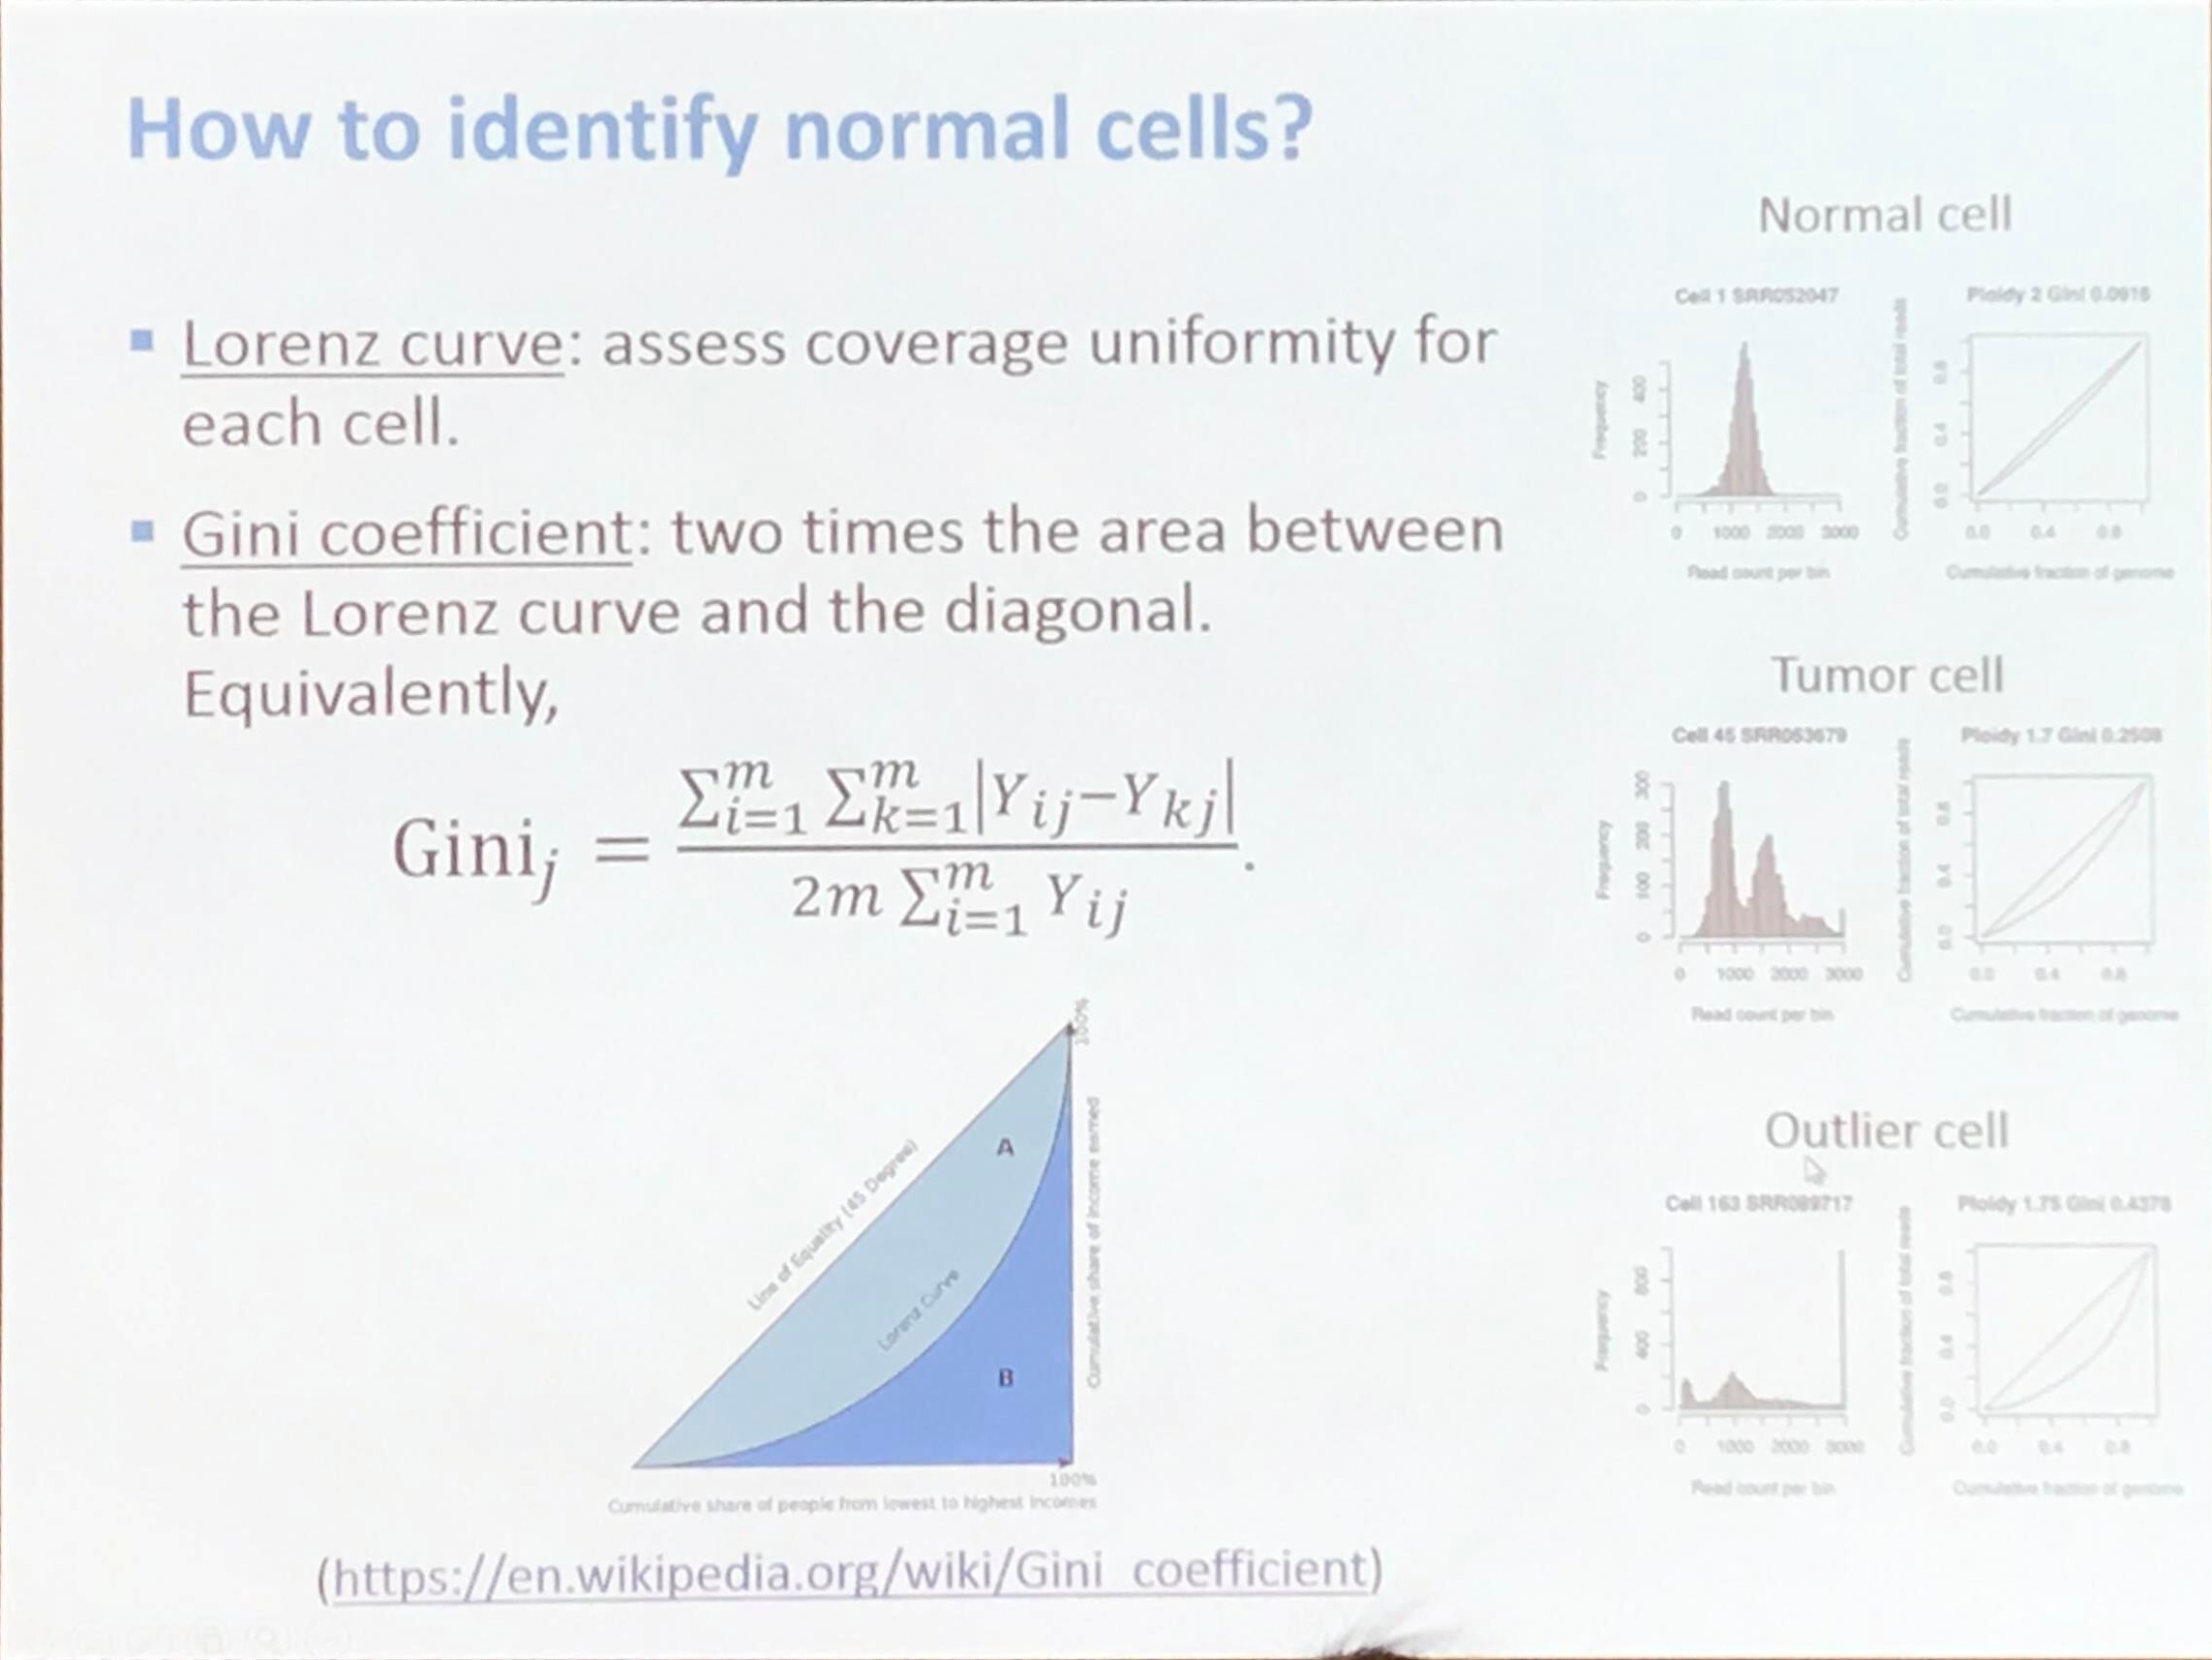
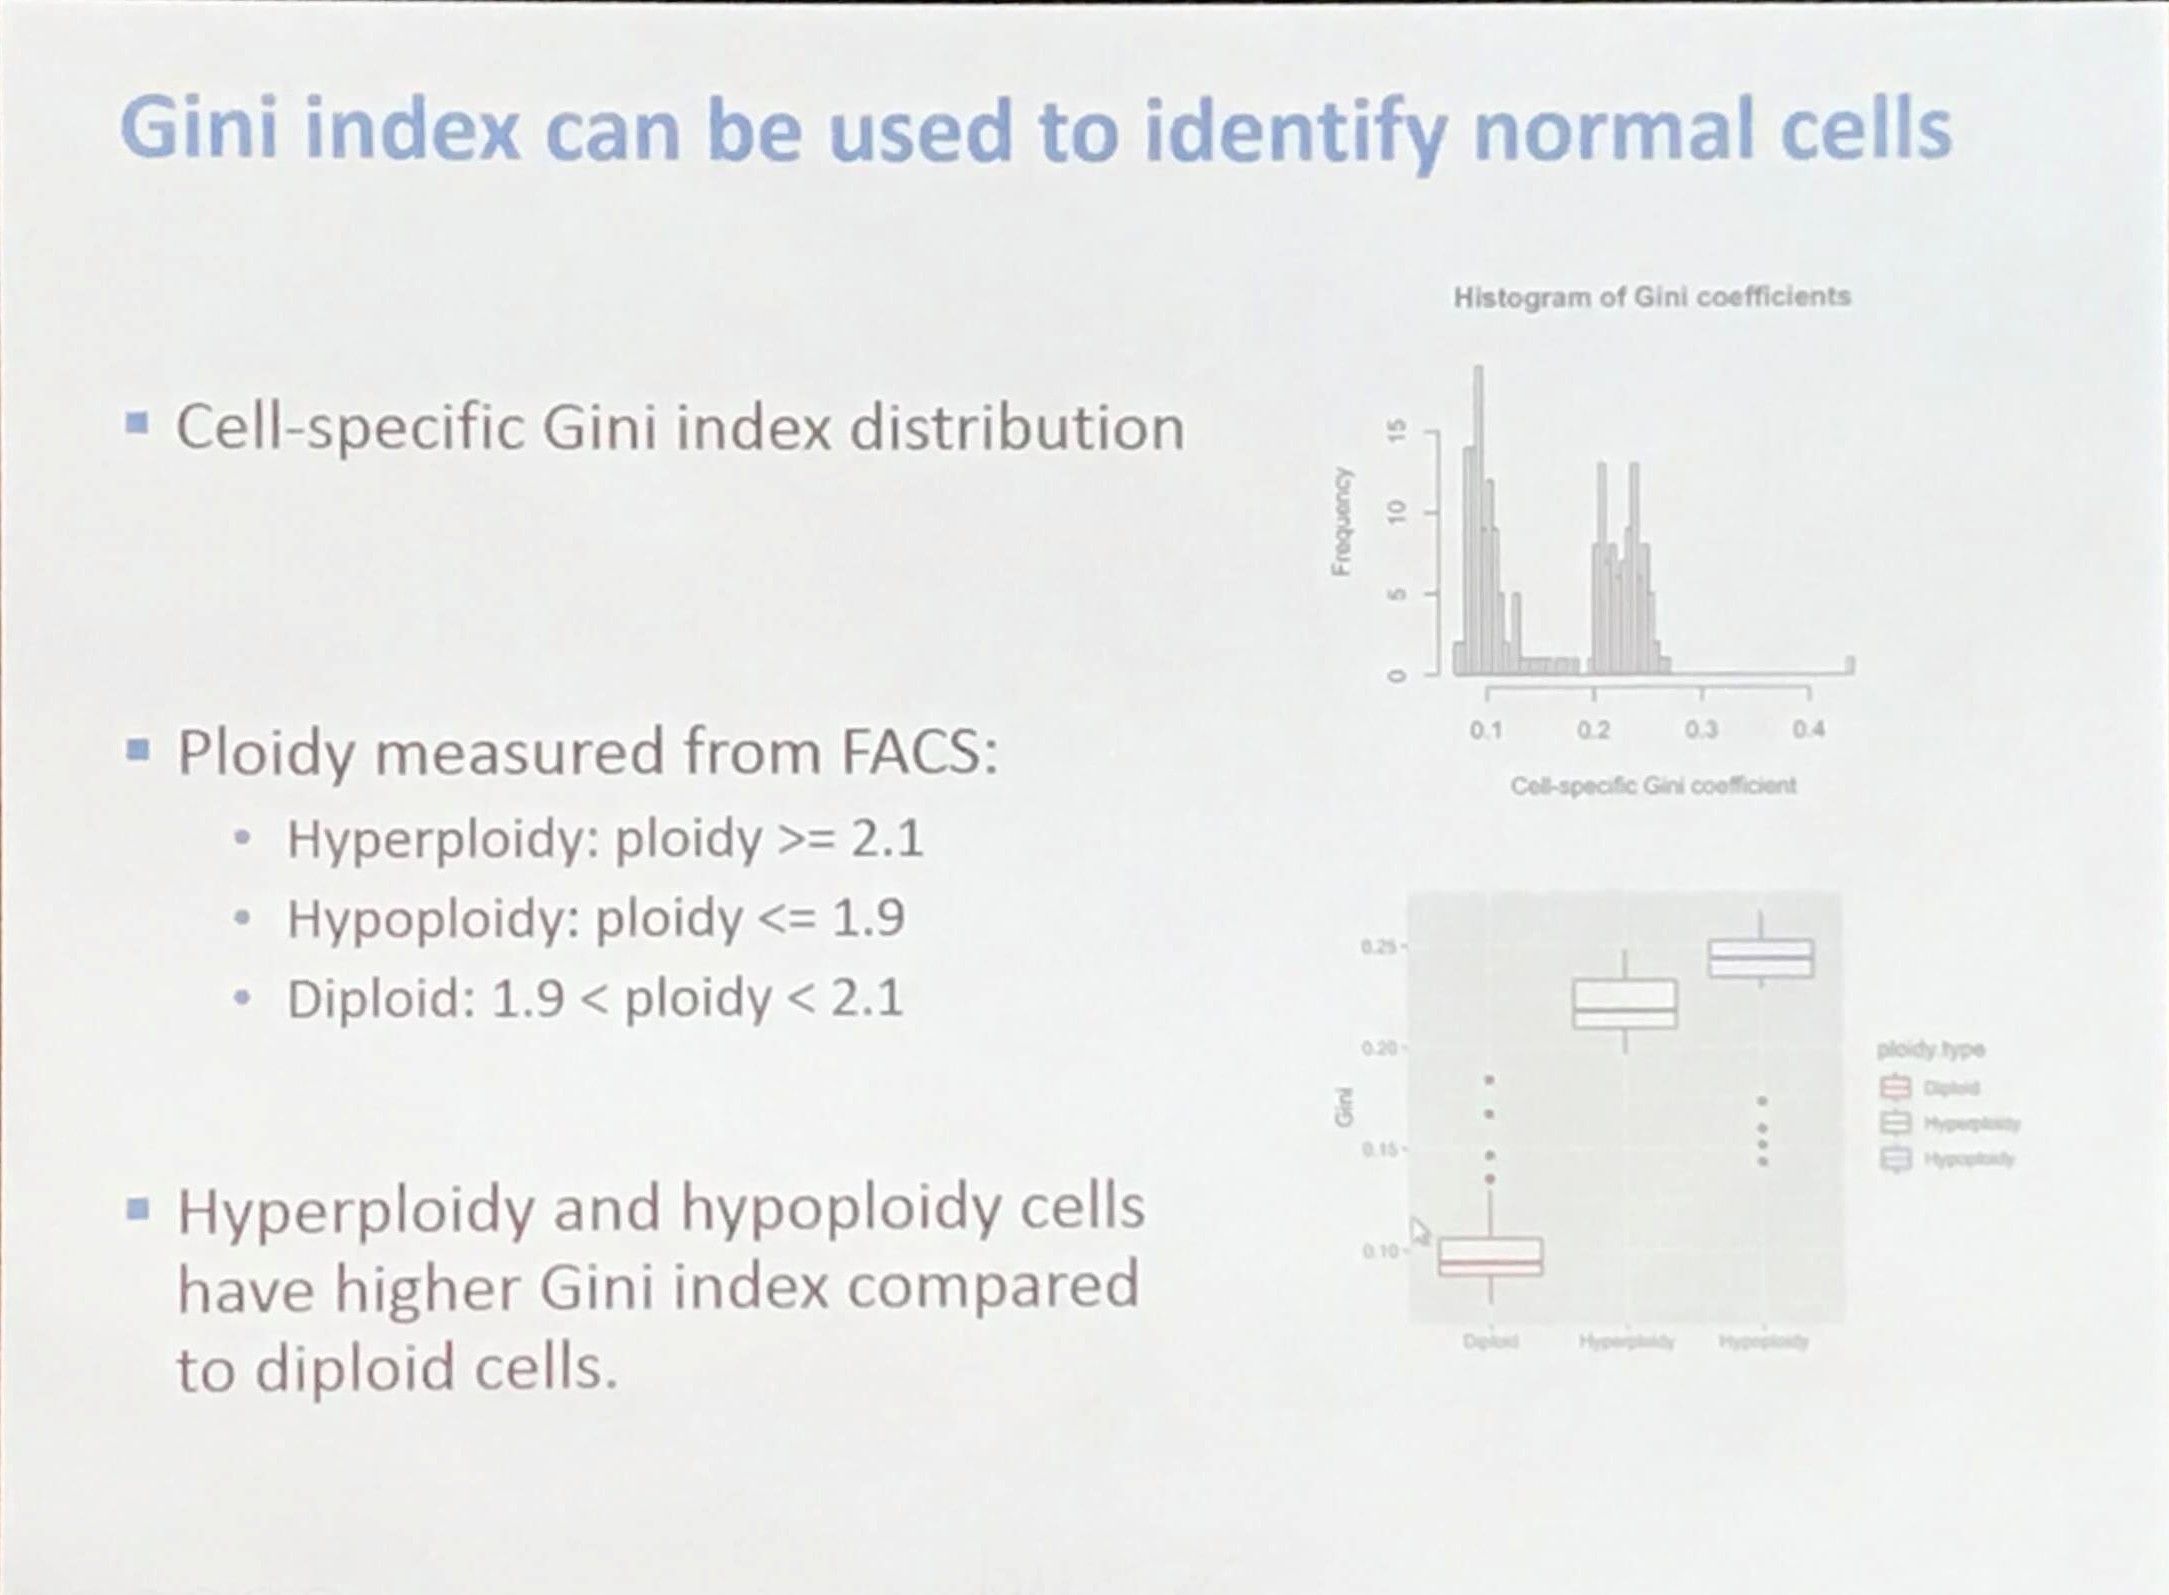
How to identify normal cells?
The Gini coefficient is calculated as
\[G = \frac{A}{A+B} = 2A = 1-2B\,.\]A short but clear introduction for the Gini coefficient: Gini coefficient and Lorenz curve explained
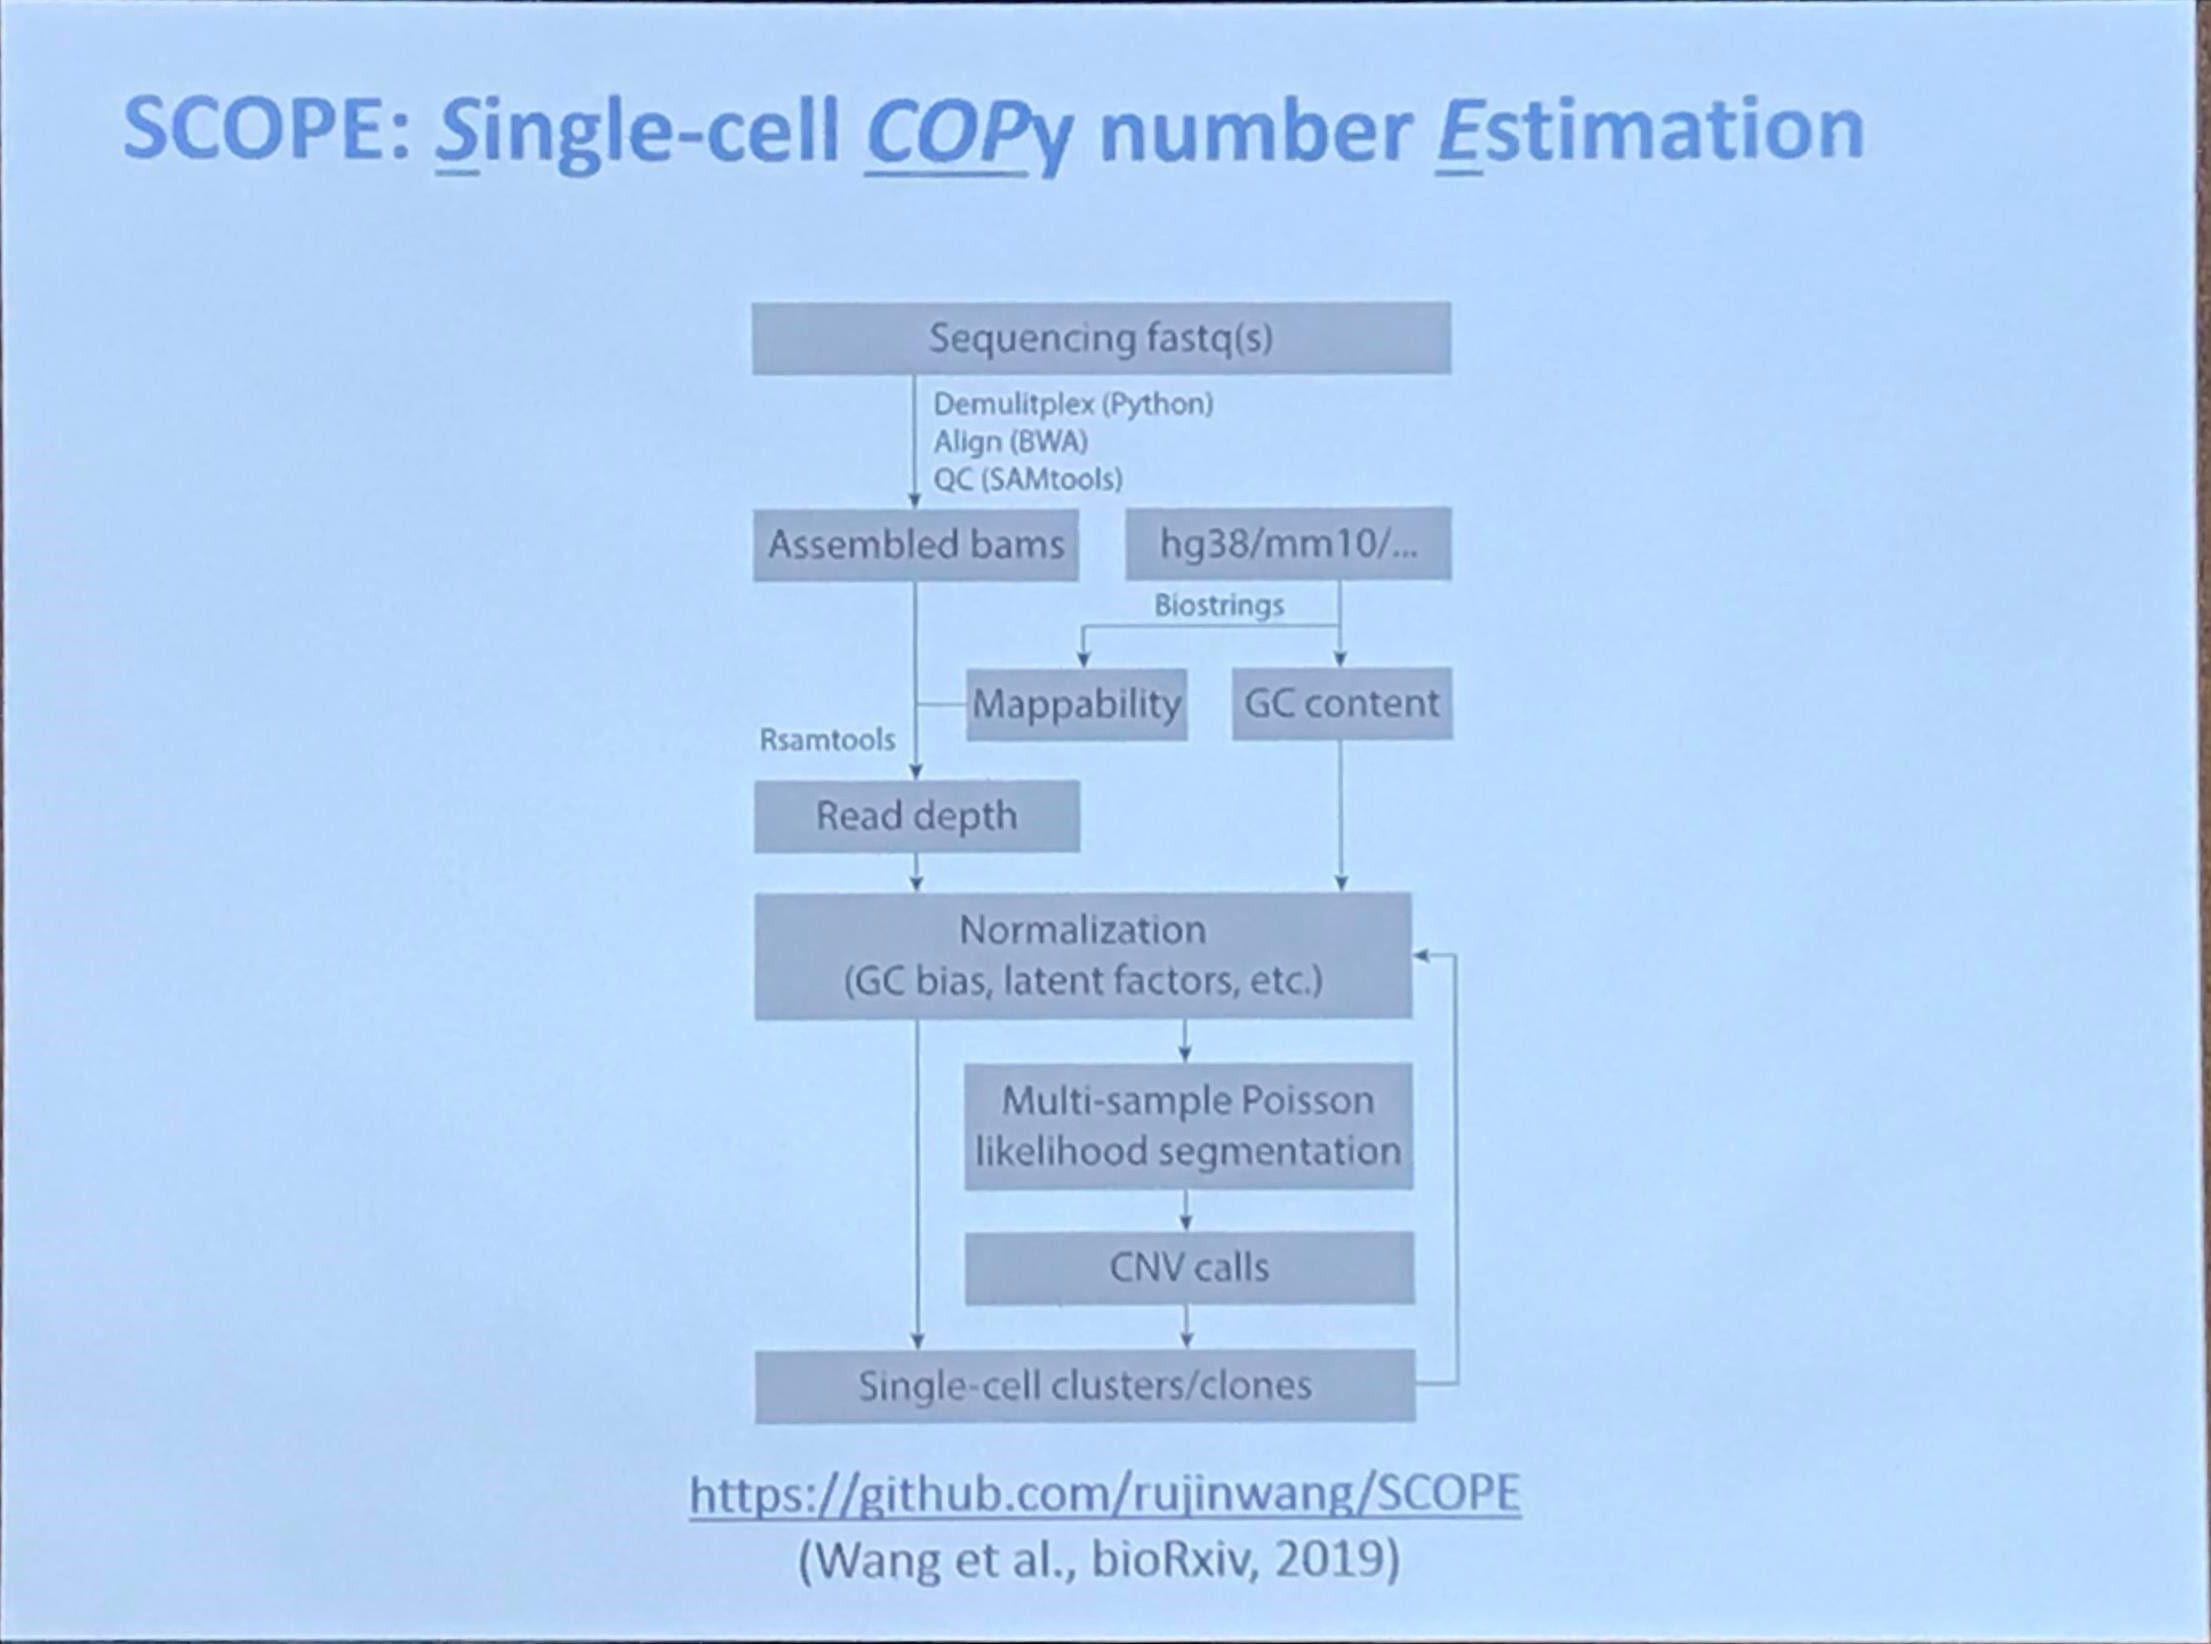
SCOPE: Single-cell COPy number Estimation
10x Genomics single-cell CNV datasets
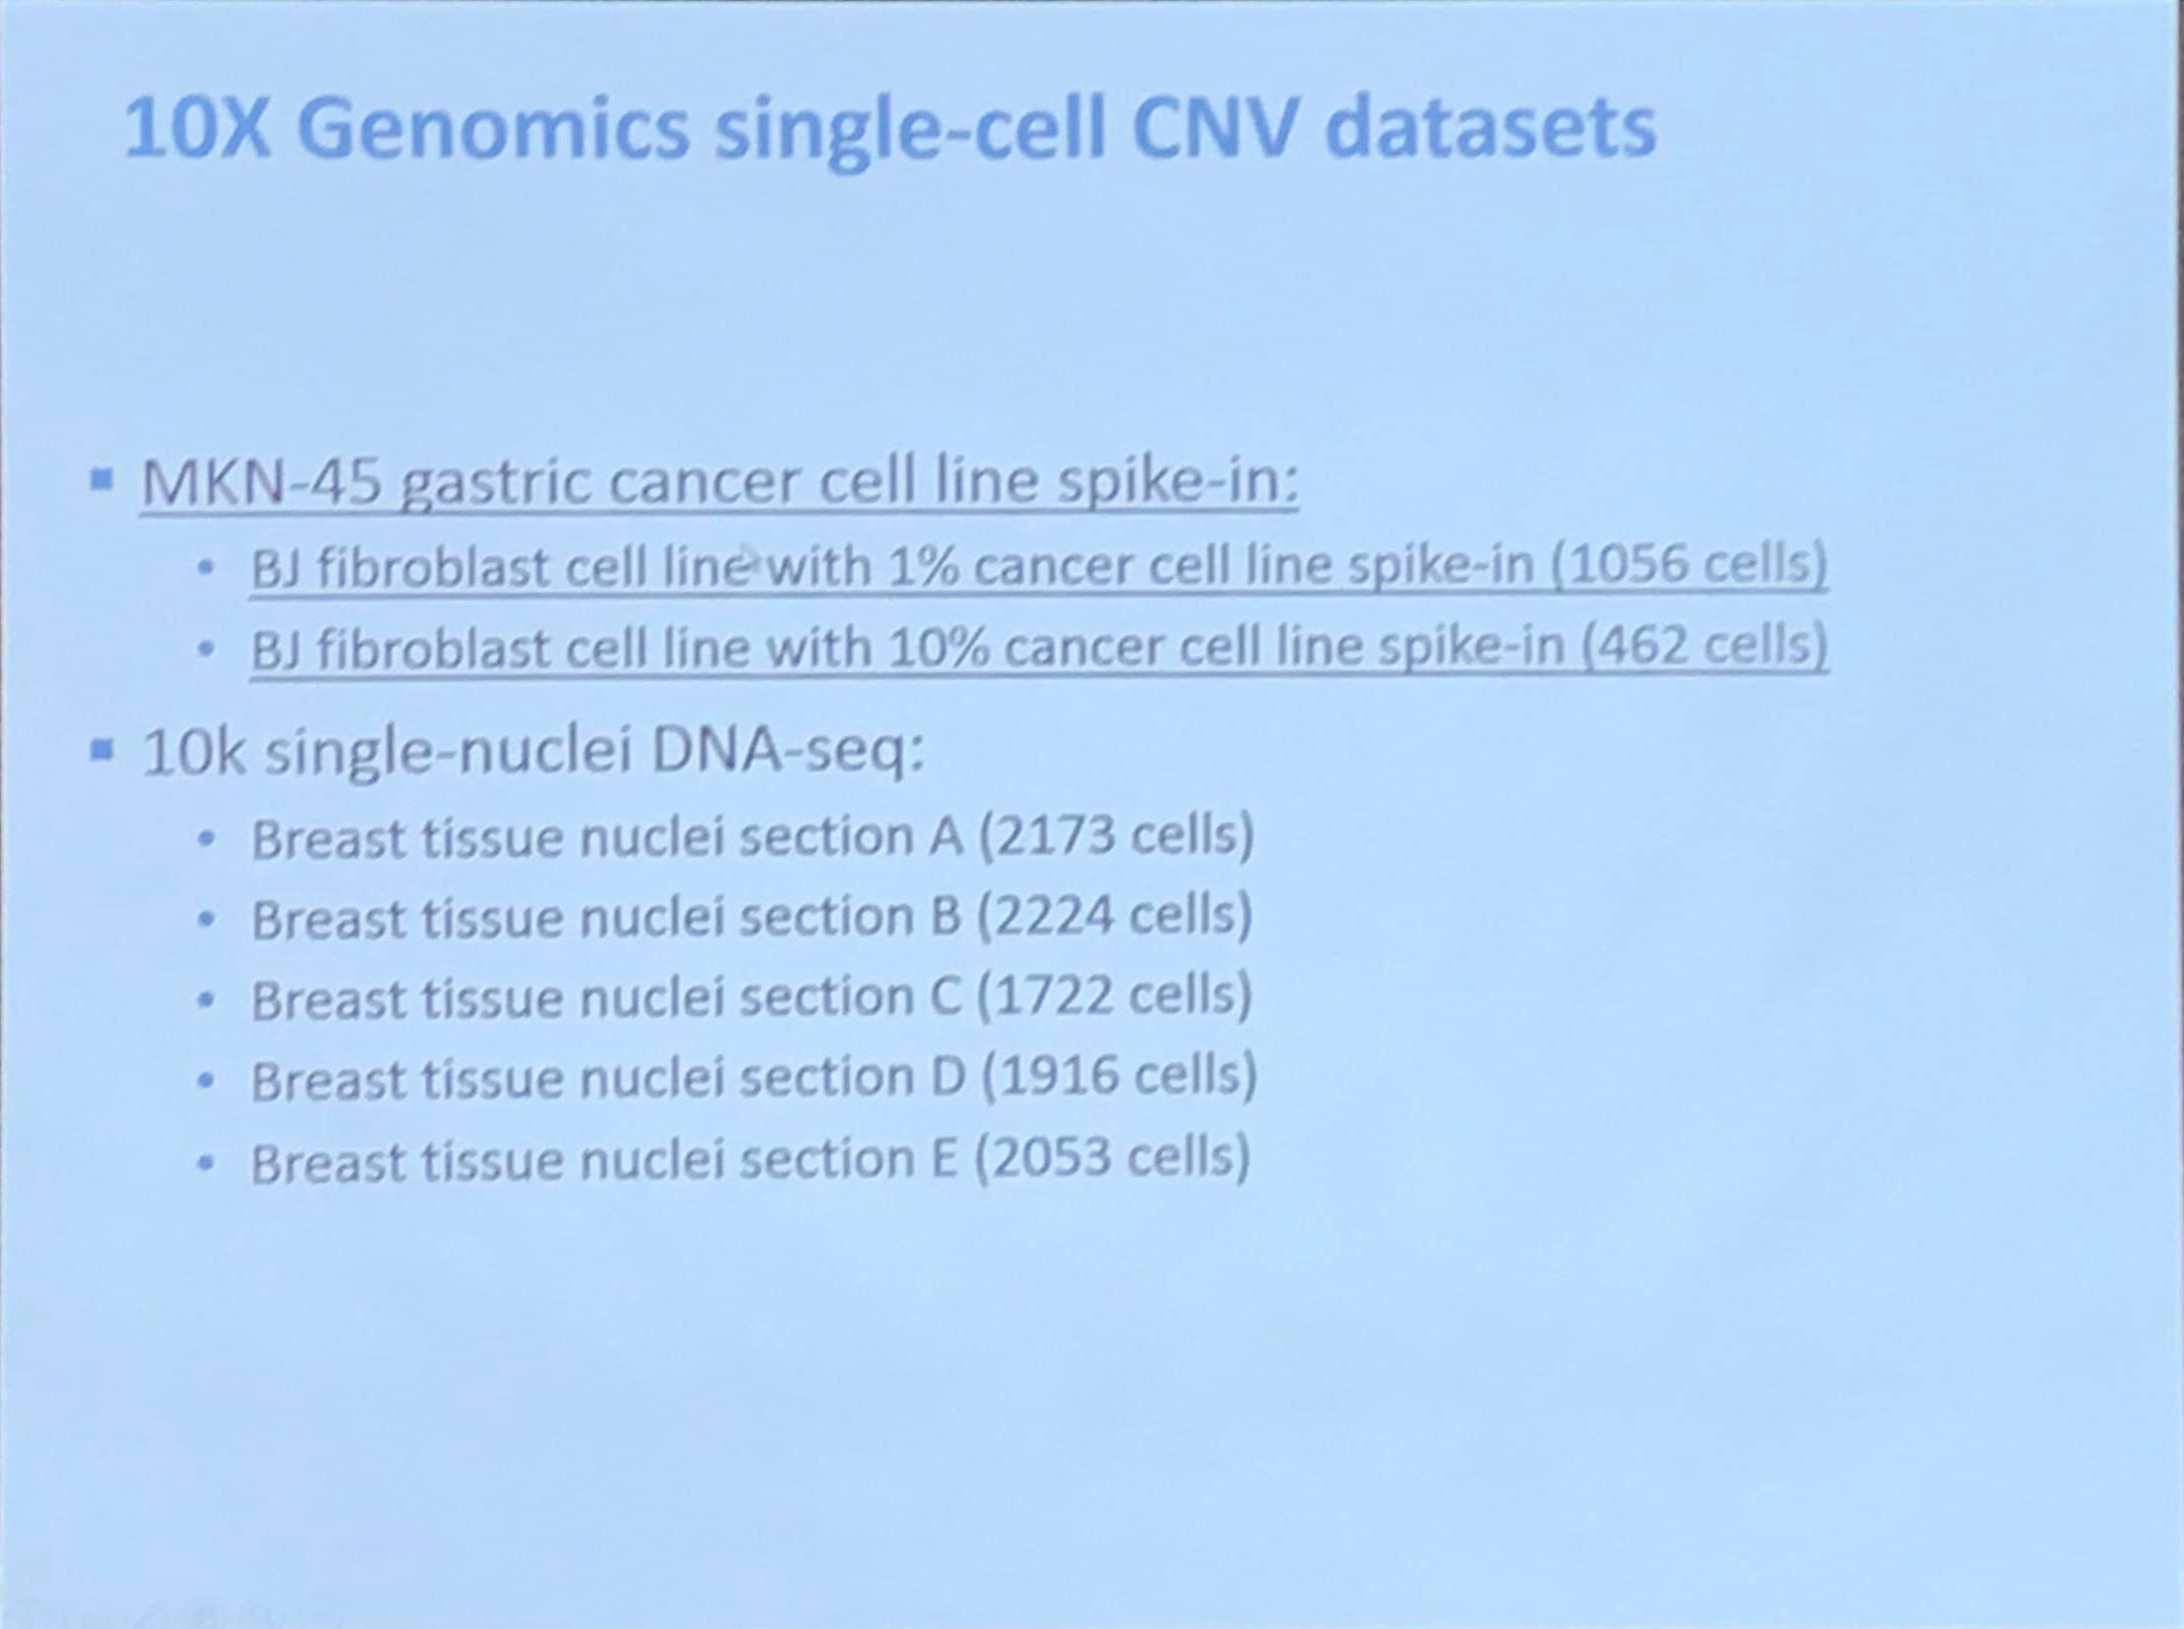
10x Genomics is a company!! Refer to 10x Genomics: 昨天今天明天 for more details.