Controlling bias and inflation in EWAS/TWAS
Posted on (Update: )
The large-scale analysis of epigenome and transcriptome data is population studies is thought to answer fundamental questions abut genome biology and will be instrumental in linking genetic and environmental influences to disease etiology (病因学), which can be seen as complementary to the vast resources of genetic data that are already available and have been used successfully in genome-wide association studies (GWAS).
The development of methodology for the analysis of EWAS and TWAS is a nascent field of research.
- In EWAS, DNA methylation levels of typically hundreds of thousands of CpG dinucleotides are individually tested for association with an outcome of interest.
- In TWAS, this is done for expression levels of tens of thousands of genes.
Currently, EWAS and TWAS heavily relies on approaches specially designed for GWAS, but epigenome and transcriptome data are crucially different from genetic data,
- they are quantitative measures (and not discrete like genotypes) that are subject to major confounding effects of technical batches and biological influences, including cellular heterogeneity.
- molecular phenotypes such as DNA methylation and gene expression often show stronger associations with phenotypic traits or complex diseases than genotypic markers.
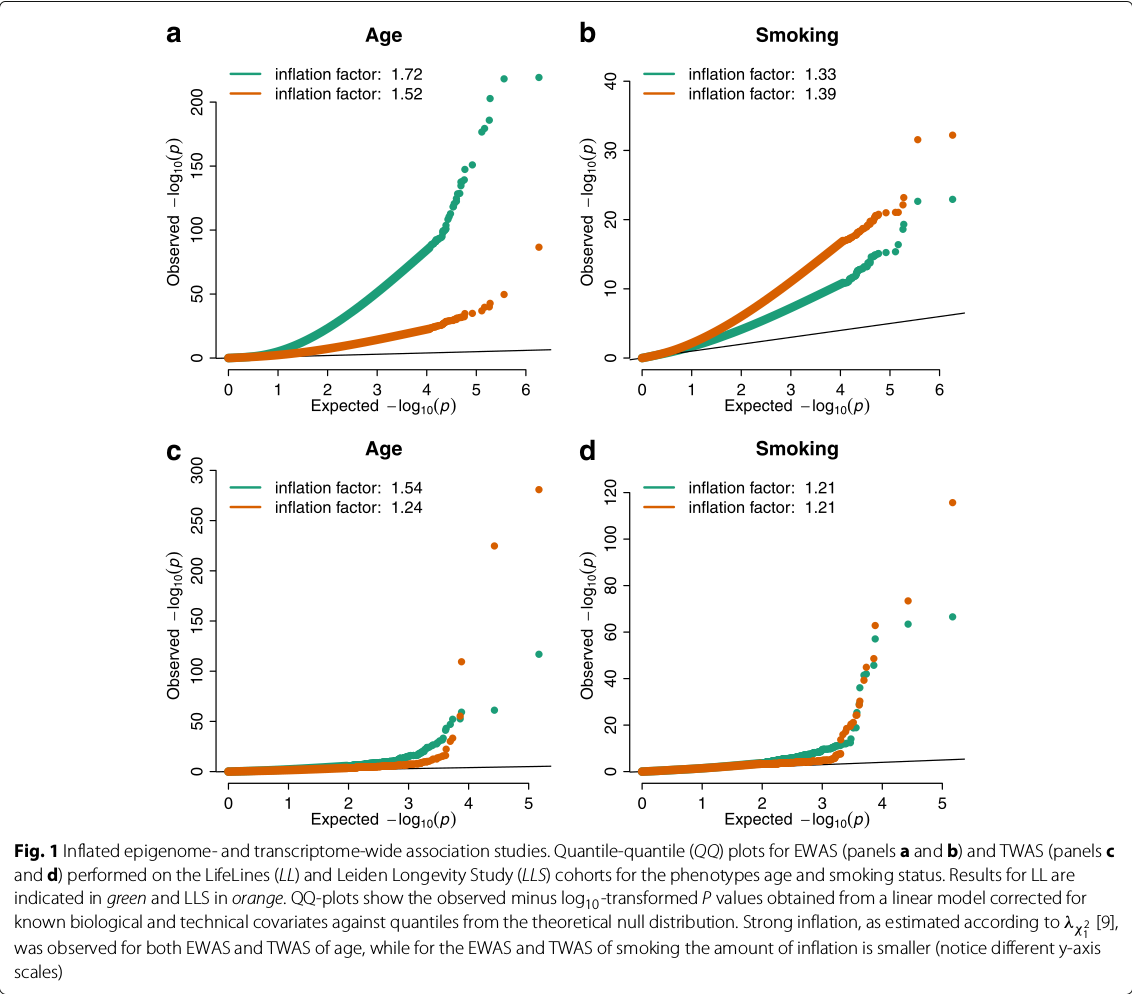
A key aspect of the analysis of ome-wide association studies is the control of test-statistic inflation. Inflation of test statistic leads to an overestimation of the level of statistical significance and dramatically increases the number of false positive findings.
In GWAS, test-statistic inflation is commonly addressed using genomic control in which the inflated test statistics are divided by the genomic inflation factor. The genomic inflation factor estimates the amount of inflation by comparing observed test statistic across all genetic variants to those expected under the hypothesis of no effect.
Crucial limitations of genomic control in GWAS: the genomic inflation factor was shown to provide an invalid estimate of test-statistic inflation when the outcome of interest is associated with many, small genetic effects. This is the rule rather than the exception for EWAS and TWAS.
Moreover, test statistics may not only be subject to inflation but also to bias, which is not corrected for when using genomic control. Bias of test statistics leads to a shift in the distribution of effect sizes and is driven by confounding, a prominent feature of EWAS and TWAS but much less concern in GWAS.
Contributions
- use simulation studies and large-scale methylome and transcriptome data to show that correcting inflated test statistic by applying genomic control is too conservative for EWAS and TWAS and that test-statistic bias cannot be ignored.
- demonstrate that test-statistic bias and inflation are represented by the mean and standard deviation of the empirical null distribution and propose a Bayesian method for its estimation. (R/Bioconductor package:
BACON) - show the utility of the method by performing an EWAS and TWAS meta-analysis of two commonly studied outcomes: age and smoking status.
Results
The genomic inflation factor is not suitable to measure inflation in EWAS/TWAS.
the QQ plots of expected versus observed test statistic, or their corresponding p values, are frequently used to visualize inflation.
the genomic inflation factor appeared to be correlated with the expected number of true associations
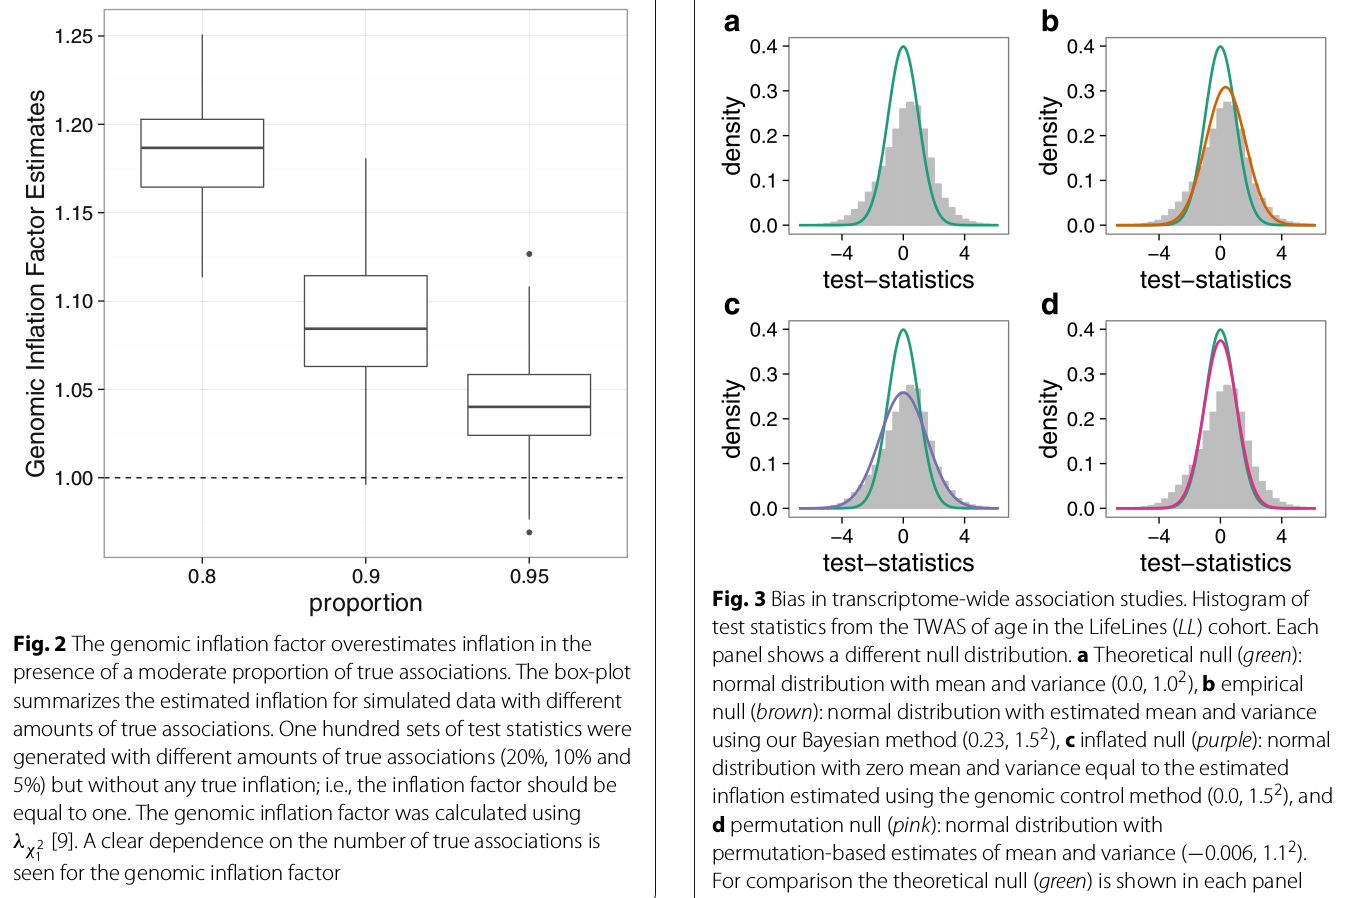
EWAS/TWAS not only suffer from inflation but also from test-statistic bias
the histogram of test statistics can show the bias of the test statistics.
Since the majority of features (being genetic variants, CpGs, or genes) are assumed not be associated with the outcome of interest, test-statistics obtained from a linear model should follow a standard normal distribution. (but there indeed some features would be significant, how to determine such unassociated features?)
(the bias is compared to (b), not the theoretical null, right?)
Estimating test-statistic bias and inflation
estimating the amount of bias and inflation is identical to estimating the parameters of the empirical null distribution
the paper develops a Bayesian method to estimate the empirical null distribution from an observed set of test statistics. The method fits a three-component normal mixture to the observed set of test statistics using a Gibbs sampling algorithm.
- one component reflects the null distribution with mean and standard deviation representing bias and inflation.
- the other two components with a positive and a negative mean capture the fraction of true associations observed in the data, which is assumed to be an unknown minority of tests
Correction for unobserved covariates reduces test-statistic bias and inflation
the primary causes of inflation and bias are thought to be unmeasured technical and biological confounding, such as population substructure, batch effects, and cellular heterogeneity.
various methods have been developed to reduce the impact of these unmeasured factors in high-dimensional data. Although all tested approaches reduced the amount of bias and inflation, residual bias and inflation were observed.
hence, the paper designed a two-stage method in order to preserve statistical power while appropriately controlling the number of false positives.
- perform an analysis that corrects for known biological and technical covariates plus estimated unobserved covariates
- estimating and adjusting the residual bias and inflation using the empirical null distribution
a simulation to evaluate the performance of the two-stage method
- a state-of-art method for unmeasured confounding: CATE
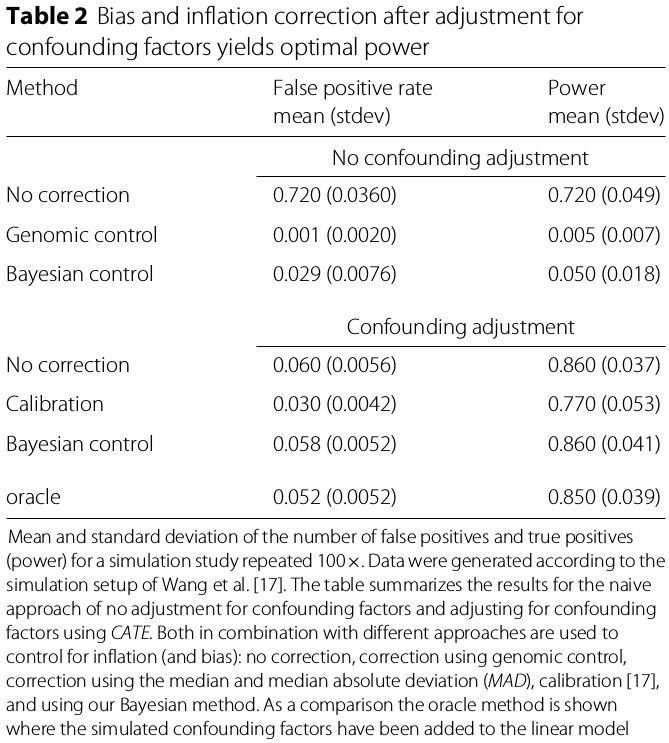
The Bayesian method in combination with CATE yielded the highest power with the fraction of false positives close to the nominal level ($0.058\pm 0.0052$) (not the smaller, the better, but what if with quite similar power, which one is better?)
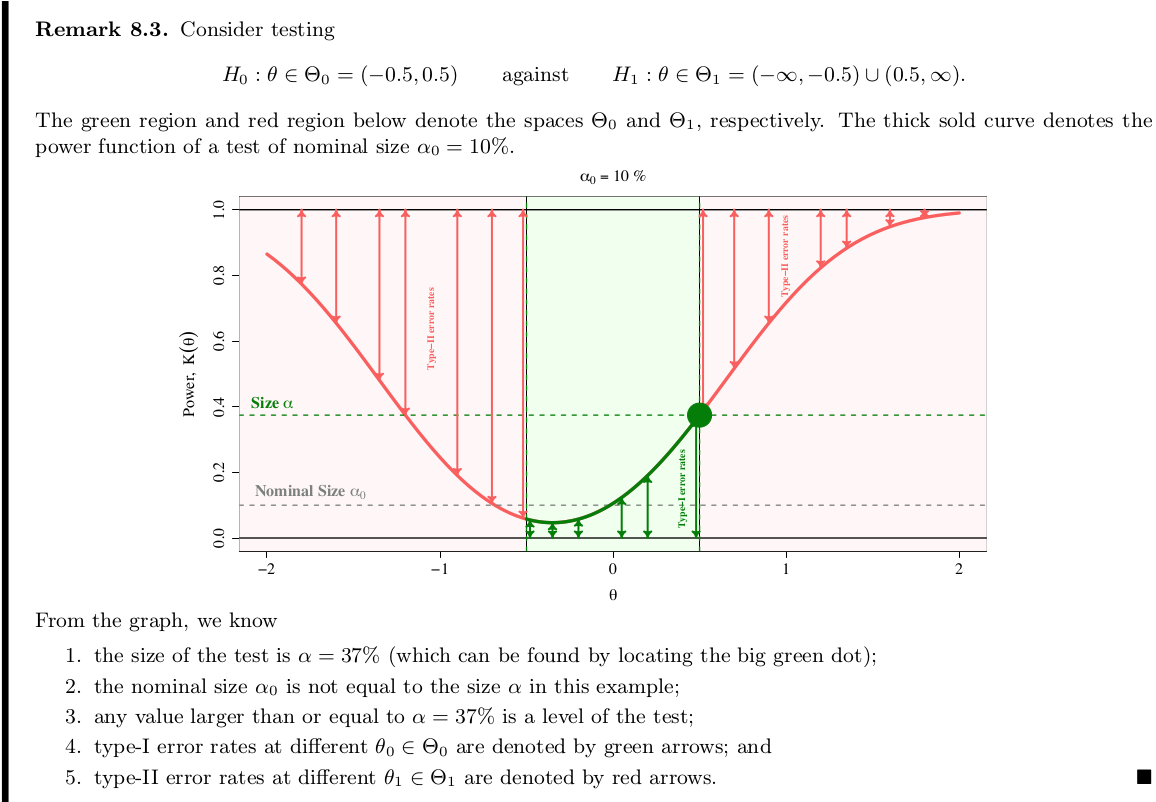
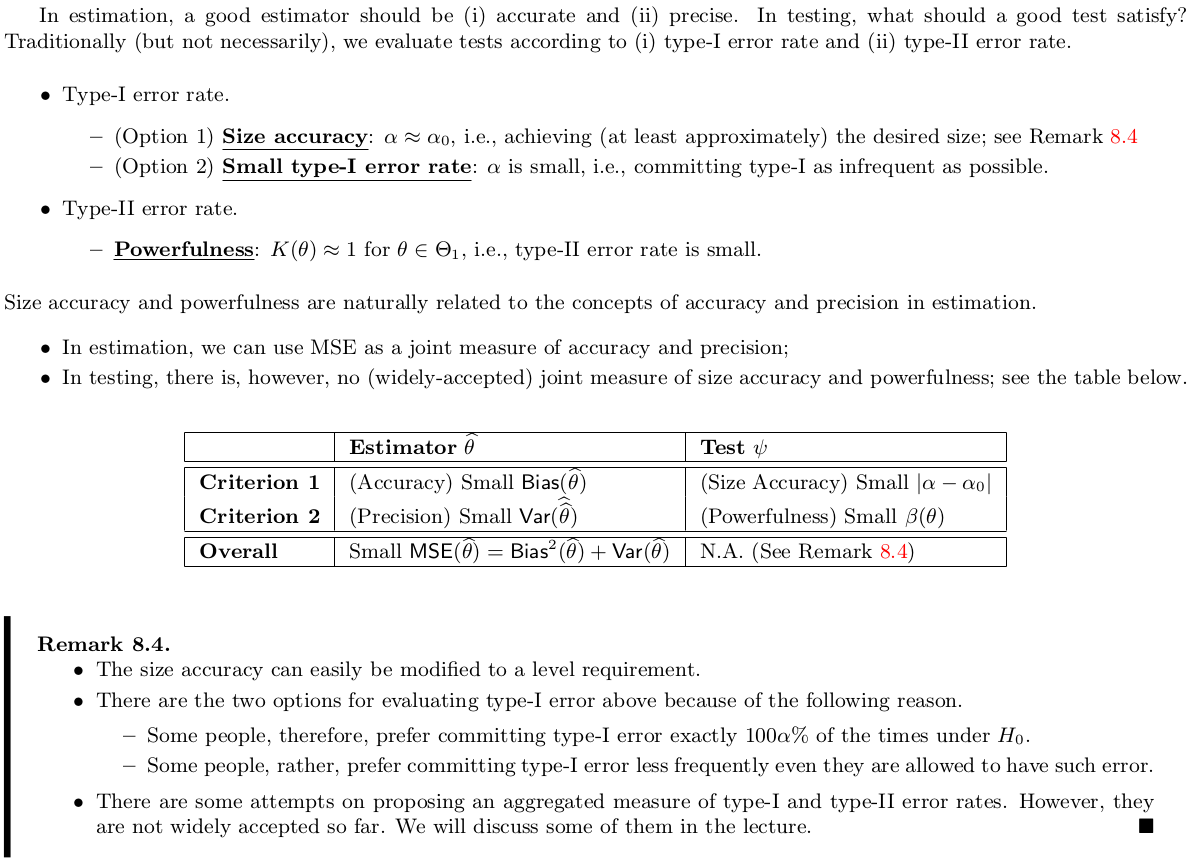
Nominal size $\alpha_0$ versus Actual size $\alpha$.
Evaluate tests
Comparison of Size Tests with Inaccurate Size
At first, I am wondering when we can get an actual size different from the nominal size. Christoph Hanck @StackExchange mentioned that this may be the case when some assumption required for the test statistic’s property is not met, e.g., many null distributions are derived asymptotically. Back here, if we can define the size-adjusted critical value $c_0$ by $P(T>c_0)=\alpha_0$, why not take $c$ such that $P(T>c)=\alpha_0$ at the very beginning?
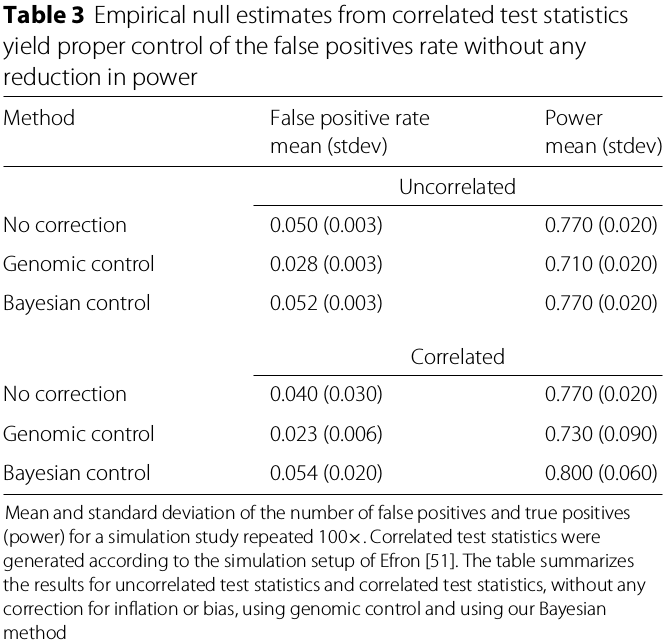
In addition to confounding, correlation between features may cause test-statistics inflation or bias. The simulation study shows that the Bayesian method properly controls the false positive rate while preserving power.
Fixed-effect meta-analysis with control for bias and inflation
A main development in the field of EWAS and TWAS, analogous to current practice in GWAS, is the combined analysis of multiple population studies to detect an increasing number of associations including those with small effect sizes.
Fixed-effect meta-analysis combines estimated effect sizes and their standard errors from different studies to construct pooled estimates resulting in higher precision of effect-size estimates and hence superior statistical power.
Perform an EWAS and TWAS of age and smoking status in four cohorts totaling 2203 individuals with methylome and 1910 individuals with transcriptome data, respectively.
The Bayesian method fully removed all bias and inflation.
Discussion and conclusion
The paper extends the work of genomic control to tackle test-statistic inflation for GWAS, and links it to the pioneering work of Efron on estimating an empirical null distribution for high-dimensional data inference.
Methods
Genomic control and the genomic inflation factor
The genomic inflation factor is the ratio of the median of a set of trend-test statistics (follows $\chi_1^2$) divided by the theoretical median, i.e.,
\[\lambda_{\chi_1^2} = \frac{\text{median}(w_1,\ldots,w_p)}{F_{\chi_1^2}^{-1}(1/2)}\,.\]Controlling the inflated test statistic by dividing the test statistics by the estimated amount of inflation is referred to as genomic control.
In EWAS/TWAS, test statistics are usually obtained from inference on the coefficients of linear regression models (instead of a trend test). Therefore, applying genomic control to these test statistics entails dividing by the square root of the genomic inflation factor, $\sqrt{\lambda_{\chi_1^2}}$.
The Gibbs sampler
Assume that the observed set of test statistics can be modeled by a three-component normal mixture
\[f(x;\epsilon,\mu,\sigma) = \sum_{j=1}^3 \epsilon_j \phi(x;\mu_j,\sigma_j)\,.\]