Coupled Minimum-Cost Flow Cell Tracking
Posted on
Abstract
Backgrounds:
- a growing number of screening applications require the automated monitoring of cell populations in a high-throughput, high-content environment
- these applications depend on accurate cell tracking of individual cells that display various behaviors including mitosis, merging, rapid movement, and entering and leaving the field of view.
Proposal:
- a general, consistent, and extensible tracking approach that explicitly models cell behaviors in a graph-theoretic framework.
- introduce a way of extending the standard minimum-cost flow algorithm to account for mitosis and merging events through a coupling operation on particular edges.
- the resulting graph can be efficiently solved using algorithms such as linear programming to choose the edges of the graph that observe the constraints while leading to the lowest overall cost.
- the tracking algorithm relies on accurate denoising and segmentation steps for which the paper used a wavelet-based approach that is able to accurately segment cells even in images with very low contrast-to-noise.
- the framework is able to measure and correct for microscope defocusing and stage shift
Introduction
Researchers use automated microscopes to run large numbers of experiments in a high-throughput and high-content fashion over extended periods of time.
96-well-plates: each well represents a different experiment and contains several hundred cells that are imaged over several hours or days resulting in the image acquisition of several hundred thousand cells.
core challenge:
- a large number of cells to be tracked
- the cells have similar appearance, making them difficult to distinguish
- events such as mitosis, cell death, occlusion, growth, sudden rapid movement, and cells moving into and out of the field of view need to be accurately captured
the goal of this work: the design of a tracking and segmentation framework that addresses these challenges
the problem of cell tracking has been extensively studied in the past, and many effective approaches have been developed. These approaches generally adapt some cell established algorithmic framework, such as contour evolution or stochastic filtering, to the cell tracking problem and include extensions or post-processing steps to fit those frameworks to the challenges specific to cell tracking.
The paper develops a mathematical framework that formulate the cell tracking problem using a single model that is consistent, extensible, general, efficient, and requires few parameters.
- consistent: it models many cell behaviors
- extensible: new behavior models can be added using appropriate weighting functions
- general: it handles control and pathological cases implicitly without the need for parameter adjustment
- does not depend on the imaging modality or image dimension since it is based on the comparison of features of segmented objects
State of the Art
Tracking
three groups:
- model-based contour evolution
- stochastic filtering
- mean-shift
- Kalman filter
- particle filter
- independent segmentation of individual frames followed by data association
Segmentation
Many of the cell tracking approaches require some simple cell detection step rather than accurate cell segmentations. However, the segmentation itself can yield information about the change in cell size, shape, and morphology that can lead to important biological insights such as the type of cell death induced by a particular treatment.
A common approach:
- binarize the image using some thresholding technique
- use the watershed algorithm on either the intensities, gradients, shapes as derived from the binary mask, or other measure or combination of measures.
Level set methods are another effective method for segmentation.
Wavelets are an effective tool for decomposing an image in both the frequency and spatial domain. Wavelet frames are a wavelet variant that avoids the sub-sampling at each decomposition level.
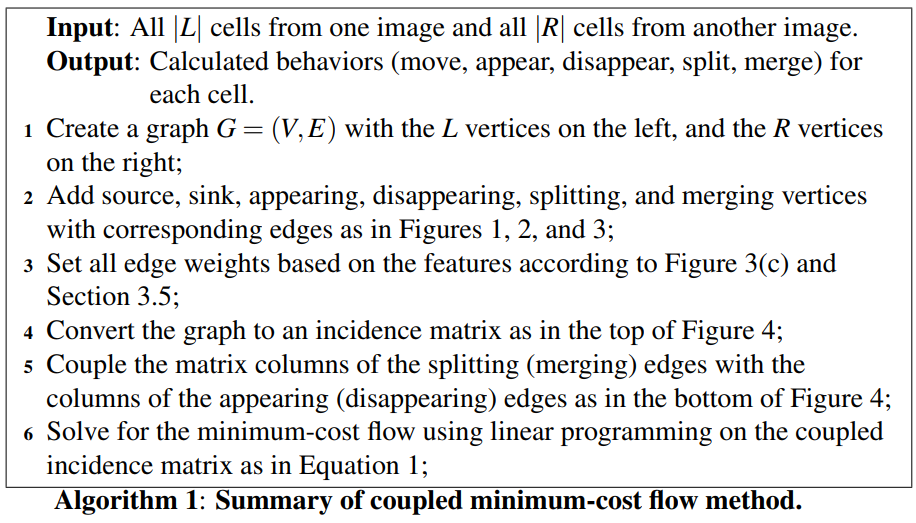
Coupled Minimum-Cost Flow Tracking
Formulating the association problem in a graph-theoretic framework as a flow network that can be solved efficiently using the minimum-cost flow algorithm.
- such flow networks are generally limited to one-to-one matches, but the method can handle entering and leaving cells.
- introduce a method called “coupled minimum-cost flow”, which enforces a coupling of the flow of certain edges that enables it to handle mitosis and merging events that require one-to-many and many-to-one associations, respectively.
Bipartite Graphs and Minimum-Cost Flow
Bipartite graphs can be used to represent the objects that need to be matched between two adjacent sets. A bipartite graph is an undirected graph $G=(V,E)$ whose vertices $V$ can be divided into two disjoint sets $L$ and $R$ such that every edge $E$ in the graph connects a vertex in $L$ to a vertex in $R$.
Given such a graph, a matching is a subset of edges $M\subset E$ such that, for all vertices $\nu\in V$, at most one edge of $M$ is incident on $\nu$. We say that a vertex $\nu\in V$ is matched by matching $M$ if some edge in $M$ is incident on $\nu$; otherwise, $\nu$ is unmatched by matching $M$.
A maximum matching is a matching $M$ of maximum cardinality such that for any matching $M’$, $\vert M\vert\ge \vert M’\vert$.
The unweighted bipartite graph is limited to finding matchings of maximum cardinality where all edges have equal cost. For matching cells across two images, weights can be defined for each pair of cells based on some measurement. A minimum weighted bipartite matching is defined as a matching where the sum of the values of the edges in the matching have a minimal value. Finding such a matching is known as the assignment problem.
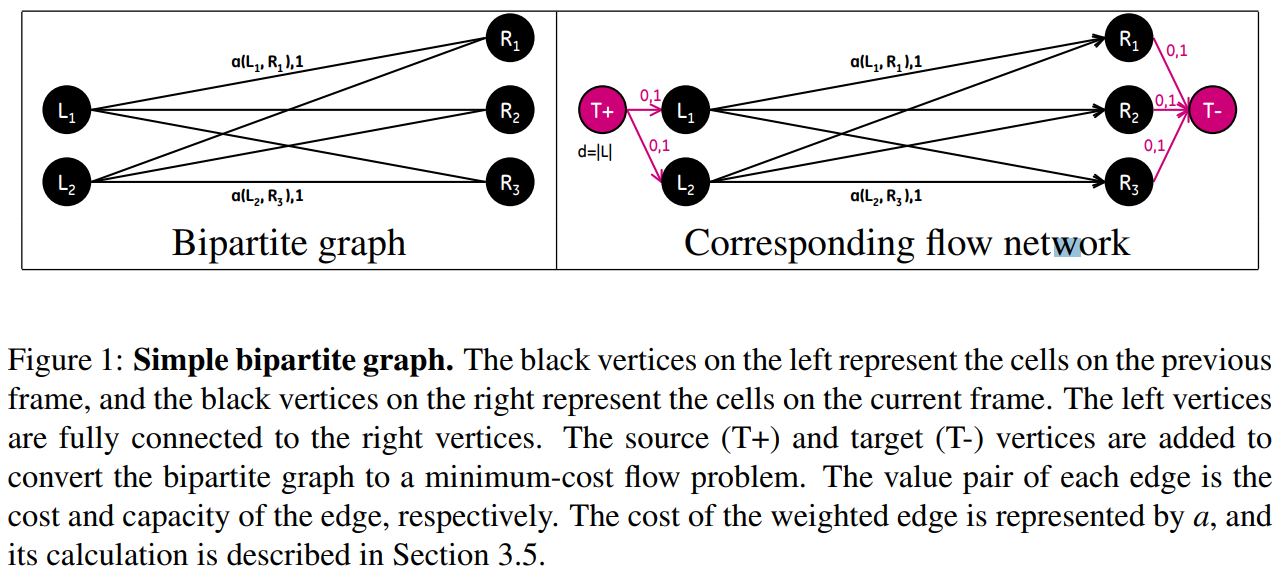
Maximum matching and assignment problems can be represented as a flow network problem. Converting from a maximum matching or assignment problem to a minimum-cost flow problem is accomplished by defining a flow network $G=(V,E)$.
\[\begin{align*} \text{minimize the flow cost} & \sum_{(u,v)\in E}a(u,v)f(u,v)&\\ \text{subject to} &&\\ \text{Capacity constraint:} & f(u, v)\le c(u,v)&\text{for each }u,v\in V\\ \text{Skew symmetry:} & f(u,v) = -f(v,u) &\text{for each }u,v\in V\\ \text{Flow conservation:} & \sum_{\nu\in V}f(u,v) = 0 &\text{for each }u\in V - \{T+,T-\}\\ \text{Flow requirement:} & \sum_{\nu\in V}f(T+,\nu)=d &\,. \end{align*}\](The paper said for the minimum-cost flow problem, we also given a flow requirement $d$ with the goal of sending $d$ units of flow from $T+$ to $T-$ in such a way that the total cost incurred by the flow is minimized. Is it necessary?)
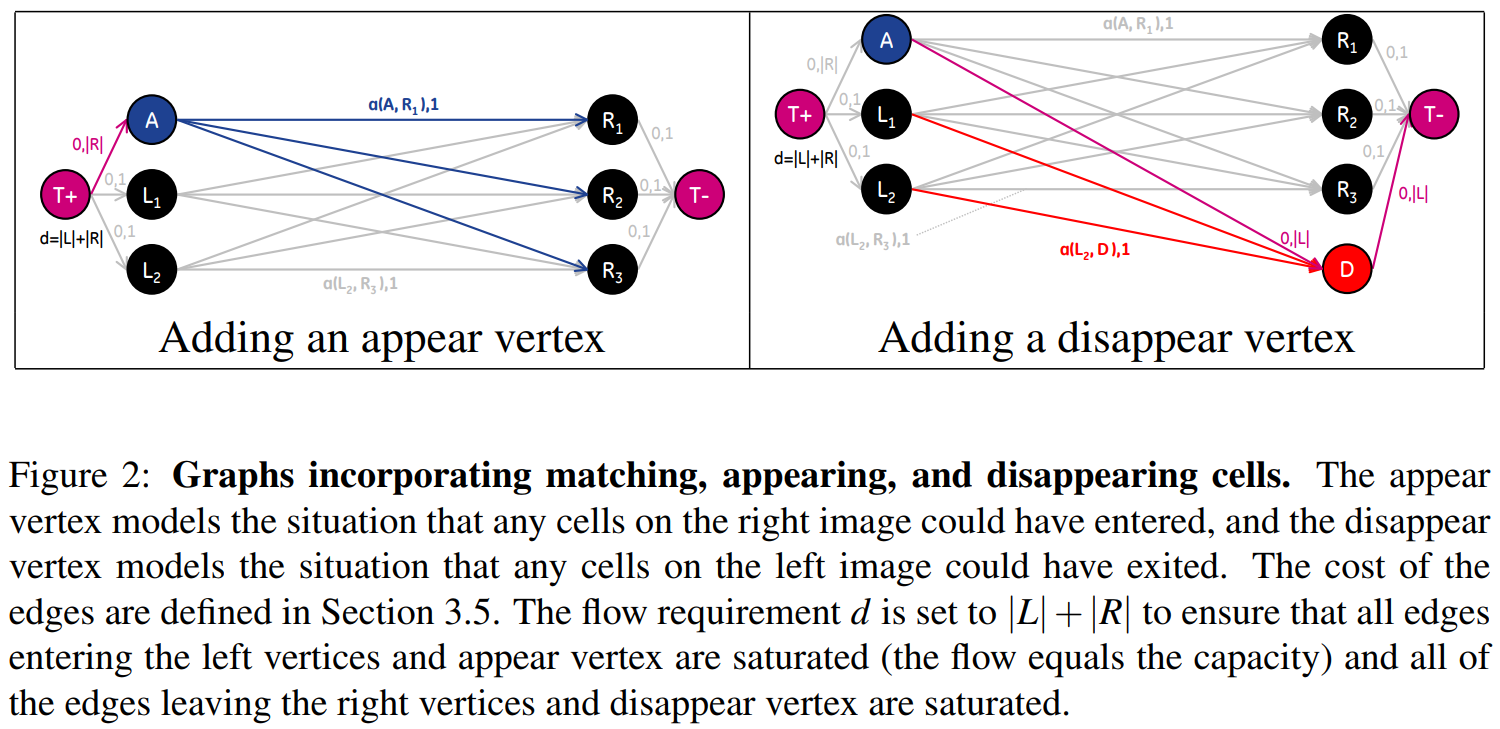
Extending the Graph for Modeling Appearing and Disappearing Cells
Introduced models for cells entering and leaving by adding A (appear) and D (disappear) vertices to the graph.
Extending the Graph for Modeling Splitting and Merging Cells
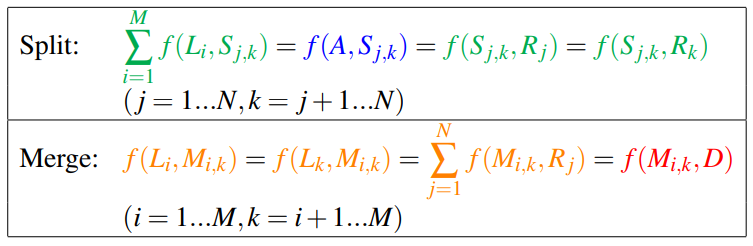
Although accounting for cells entering and leaving the image could be modeled in the graph by adding vertices with connections to the source and sink vertices of the graph, splitting and merging cells cannot be represented directly. This is due to the fact that the number of edges entering a split (merge) vertex is different from the number of edges leaving, which violates the flow conservation constraint of the graph.
A constraint is needed to ensure that exactly two units flow to and from splitting and merging vertices when those vertices are part of the solution.
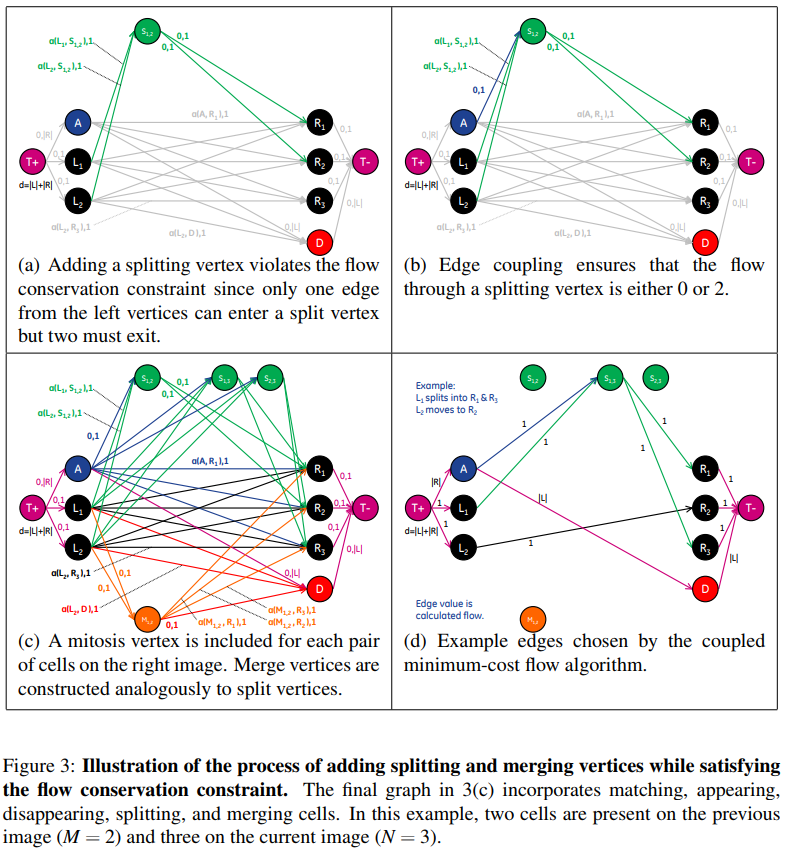
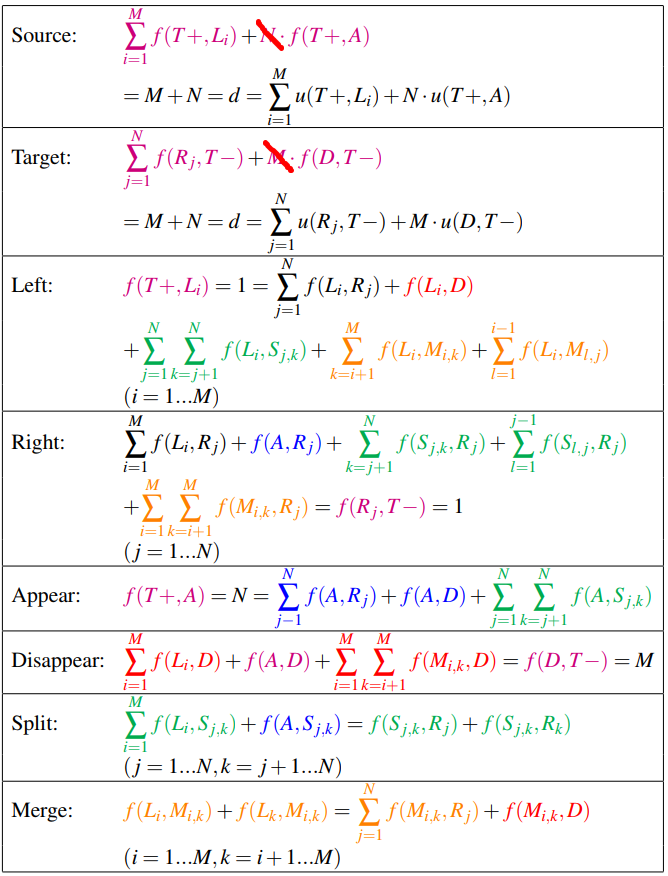
The flow equations are as follows:
(I am wondering if it is necessary to consider $f(A,D)$)
The coupling can be enforced by simply setting equal all terms in both “split” and “Merge” equations:
Solving the Coupled Minimum-Cost Flow Problem
For each split (and merge) vertex, the columns representing the two edges entering and the two edges leaving the vertex (for a total of four columns) are added together to form a new column, and the four columns are removed. This yields a column that has more than two nonzero entries for each split (and merge) vertex, in order for this column to be included in the solution, all edges included in this combined column must be chosen together.
Using the coupled incidence matrix, finding the optimal matches corresponds to finding a subset of columns in this matrix such that the sum of the cost of these columns is minimized, under the constraint that no two columns share common nonzero entries.
\[\min_x c^Tx\quad \text{subject to: }Ax\le b\]where
- $c$: the vector of costs
- $b$: a vector of size $\vert V\vert\times 1$ representing the sum of the flow for each vertex, 0 for all vertices except source and target
- $A$: the coupled incidence matrix
- $x$: a binary $\vert E\vert\times 1$ solution vector that is 1 if the row is in the solution and 0 otherwise.
Calculation of Association Costs
Regardless of the sign of the costs, the algorithm will not revert to the trivial solution where none of the edges are chosen because of the flow requirement $d$ of the coupled minimum-cost flow framework.
Given the segmentations, calculate a set of features $\zeta$ on each cell and calculate feature difference vectors between cells on adjacent images $\theta(u,v)=\vert \zeta(u)-\zeta(v)\vert$. Any features of the cells can be used for this step such as location, area, eccentricity, and intensity as well as features calculated from the wavelet coefficients.
Cost function:
\[a(u, v) = \sum_{i=0}^Kw_i\vert\zeta_i(u) - \zeta_i(v)\vert\]where $K$ is the number of features.
- cell moving: $\theta(u, v)=\vert \zeta(u)-\zeta(v)\vert$
- cell splitting and merging: $\theta(u,(v_1,v_2))=\vert \zeta(u)-\zeta(v_1,v_2)\vert$ and $\theta((u_1,u_2),v)=\vert \zeta(u_1,u_2)-\zeta(v)\vert$
- cell appearing and disappearing: $\theta(\oslash, v) = \vert \zeta(\oslash)-\zeta(v)\vert$ and $\theta(u,\oslash)=\vert \zeta(u)-\zeta(\oslash)\vert$.
Overall Framework for Cell Tracking and Segmentation
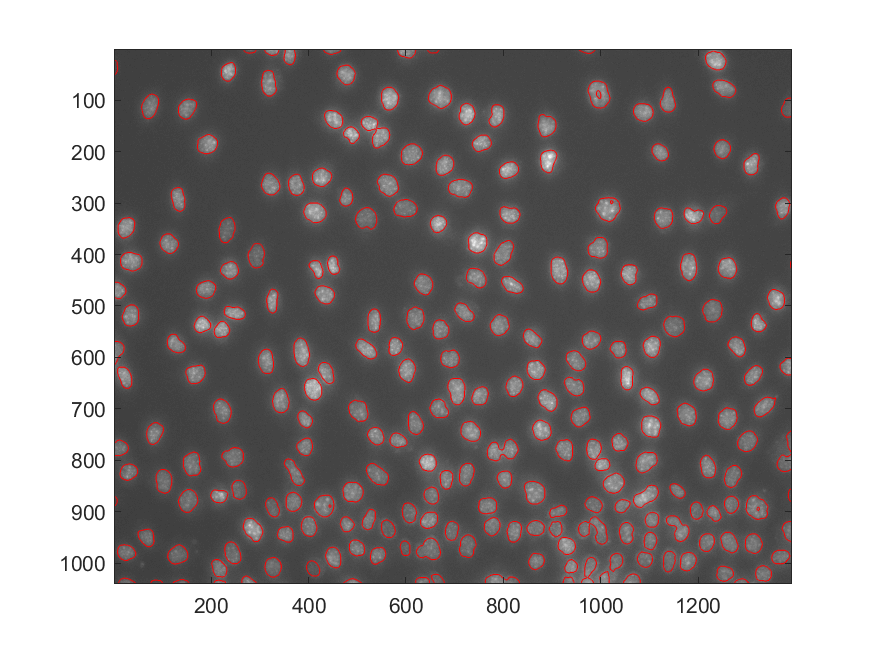
Wavelet-Based Cell Segmentation
One of the advantages of the wavelet-based method for denoising and segmentation is how it naturally represents objects at different scales.
Utilize biological insight of the cell cycle to guide the segmentation process. A cell begins its life in the G1 phase with a given cell size. As it proceeds through the cell cycle, it duplicates its DNA in the S phase and, by the end of the G2 phase, it had duplicated its internal organelles and structures and has doubled in size.
The authors (only) provided the Matlab code for the segmentation task, the resulting contour after segmentation via the wavelet method is
Global Alignment for Stage-Shift Removal
approach this as a registration problem
the registration is based on the normalized cross correlation metric.
Defocus Detection
the algorithm is based on the principle that a defocused image acquires a smoothed appearance, losing its texture.
Result
tracking and segmentation algorithms on five time-lapse datasets with varying conditions and biological hypotheses and multiple wells.
Tracking Results
Segmentation Results
Main concern for segmentation is avoiding over-segmentation or under-segmentation meaning the avoidance of the following: missing cells, finding non-existent cells, breaking a cell into smaller pieces, and detecting multiple cells as one cell.
The segmented contours were also validated for a sample of randomly selected cells. The cells were manually segmented, and the resulting masks were compared to the automatic segmentations using the Kappa Index overlap score
\[KI = 2\times \frac{\vert A\cap M\vert}{\vert A\vert + \vert M\vert}\]where $A$ is the automatic segmentation mask, $M$ is the manual segmentation mask, and the score ranges from 0 (no overlap) to 1 (perfect overlap).
Conclusions and Future Work
These algorithms have been applied to nearly 6000 images representing 400,000 cells and 32,000 tracks. A large portion of the results (25%) were validated manually by expert biologists at two different institutions, and their edits were tabulated and stored to enable reproducibility of their assessment.
(Shocked!! 25% by men’s eyes?)
Supplementary
From this video, it seems that almost all cells head for the same directions, what if more chaos?