Survey on Functional Principal Component Analysis
Posted on
This post is based on Shang, H. L. (2014). A survey of functional principal component analysis. AStA Advances in Statistical Analysis, 98(2), 121–142.
A review of functional component analysis, and its use in explanatory analysis, modeling and forecasting, and classification of functional data.
In a broader term, functional data analysis (FDA) refers to the statistical analysis of data consisting of random functions, where each function is considered as a sample from a stochastic process. FDA methodology provides a new statistical approach to the analysis of independent or times series of random functions generated from one or more stochastic processes.
Some extensions and modifications of FPCA,
- smoothed FPCA: at least two ways of performing smoothed FPCA
- smooth the functional data before applying FPCA
- directly define smoothed principal components by adding a roughness penalty term to the sample covariance and maximizing the sample covariance (?)
- robust FPCA: a serious drawback to the estimator of principal components is their sensitivity to outliers.
- Locantore et al. (1999): robust estimators for the principal components by adapting a bounded influence approach
- Gervini (2008): a fully functional robust estimators which are functional versions of the multivariate median and spherical components
- Hyndman and Ullah (2007): a robust estimator based on a robust projection-pursuit approach to forecast age-specific mortality and fertility rates observed over time.
- Fraiman and Muniz (2001): identify and remove outliers, propose the trimmed means using the notion of functional depth
- Sparse FPCA: when only a few and much irregularly spaced data points
- Rice and Wu (2001): the use of mixed effects model to estimate functional principal components, where each functional data $X_i$ can be estimated by all functions not only the $i$-th function, but may be ill-posed.
- James et al. (2000) and James and Sugar (2003): the reduced rank model
- Zhou et al. (2008): extend the reduced rank model to two-dimensional sparse model via a penalized estimation and splines.
- Kayano and Konishi (2010): extend the reduced rank model to multidimensional sparse functional data.
- Yao et al. (2005a): through conditional expectation to solve the issue of sparse and irregular functional data, provided that the number of subjects increases and the pooled time points from the entire sample become dense in the domain of the data
- Common FPCA: for a group of functional data samples
- Benko et al. (2009): propose common functional principal component estimation and presented a bootstrap test for examining the equality of the eigenvalues, eigenfunctions and mean functions of two functional data samples
- Boente et al. (2010): statistical inference under common functional principal components
- Multilevel FPCA: sometimes functional data generated from at least two stochastic processes, e.g., a patient’s health status is monitoring by his/her intraday blood pressure and heart beat over a time period.
- Di et al. (2009): extract the intra- and inter-subject geometric components of multilevel functional data.
- Crainiceanu et al. (2009): extend the idea of multilevel FPCA to functional regression
- Zipunnikov et al. (2011): fast and scalable multilevel FPCA for analyzing hundreds and thousands brain images scanned using magnetic resonance imaging.
Computation
- Discreization
- Basis function expansion
- Numerical approximation
FPCA in explanatory analysis
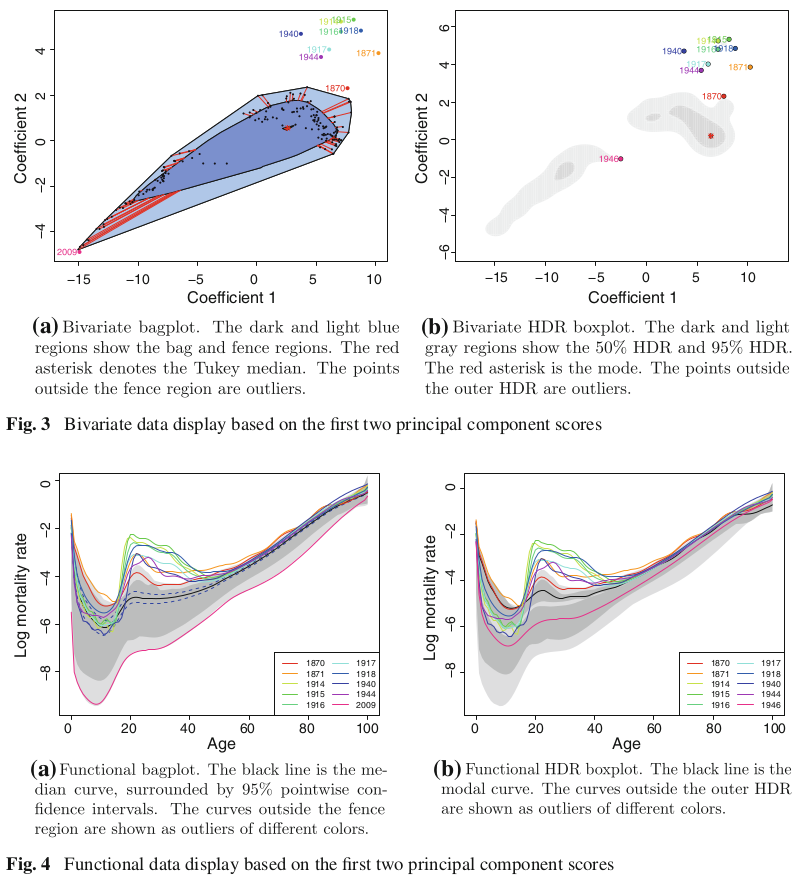
Take the first two score vectors $(\beta_{1,1},\ldots,\beta_{n,1})$ and $(\beta_{1,2},\ldots,\beta_{n,2})$. Denote the bivariate point $(\beta_{s,1},\beta_{s,2})$ as $z_s$.
-
Order the bivariate scores using Tukey’s halfspace location depth, then we can get a bivariate bagplot, which is similar to a univariate boxplot, and it has a central point, an inner region, and an outer region.
-
Order the points by the value of a bivariate kernel density estimate at each observation, then we can get a bivariate highest density region (HDR) boxplot.
The functional bagplot and functional HDR boxplot are mappings of the bagplot and HDR boxplot of the first two principal component scores to the functional curves.
FPCA in modeling and forecasting
Regardless of the type of functional regression model, there are two difficulties in using them for analyzing the relationship between predictor and response variables:
- the inverse problem of covariance structure: lead to numerically unstable estimates of regression coefficients
- curse of dimensionality: troublesome in nonparametric statistics for which the asymptotic behavior of the estimates decays exponentially with the increasing number of explanatory variables.
There are two general strategies for overcoming these problems,
- regularization
- dimension reduction: such as functional principal component regression and functional partial least squares
FPCA in classification
Difficulties:
- for functional data clustering, the intrinsic infinite dimension of functions
- for the parametric classifiers, inverting the covariance operator
- for the nonparametric classifiers, the curse of dimensionality
these difficulities motivated methods for dimension reduction.
- In supervised functional data clustering, classifiers are constructed from the functional curves and their correct membership labels.
- In unsupervised functional data clustering, classifiers are constructed solely from the functional curves.
The objective is to obtain a rule for a sample to classify a new curve by estimating its membership label.
Tandem analysis:
- perform dimension reduction by projecting functional data onto a set of lower-dimension basis functions, such as principal component basis functions, or partial least squares basis functions.
- perform cluster analysis on the first few principal component scores
Other procedures:
- Hall et al. (2001): a nonparametric procedure for signal discriminant
- Müller and Stadtmüller (2005): a parametric procedure
- Bouveyron and Jacques (2011): the model-based clustering method of functional data to find cluster-specific functional subspaces.
- …