tradeSeq: Trajectory-based differential expression analysis for single-cell sequencing data
Posted on
downstream of trajectory inference: to discover genes that are
- associated with the lineages in the trajectory
- differentially expressed between lineages
to illuminate the underlying biological processes
However, current data analysis procedures,
- either fail to exploit the continuous resolution provided by trajectory inference
- or fail to pinpoint the exact types of differential expression
The paper introduce tradeSeq, which is
- a generalized additive model framework based on the negative binomial distribution that allows flexible inference of both within-lineage and between-lineage differential expression
- by incorporating observation-level weights, the model additionally allows to account for zero inflation
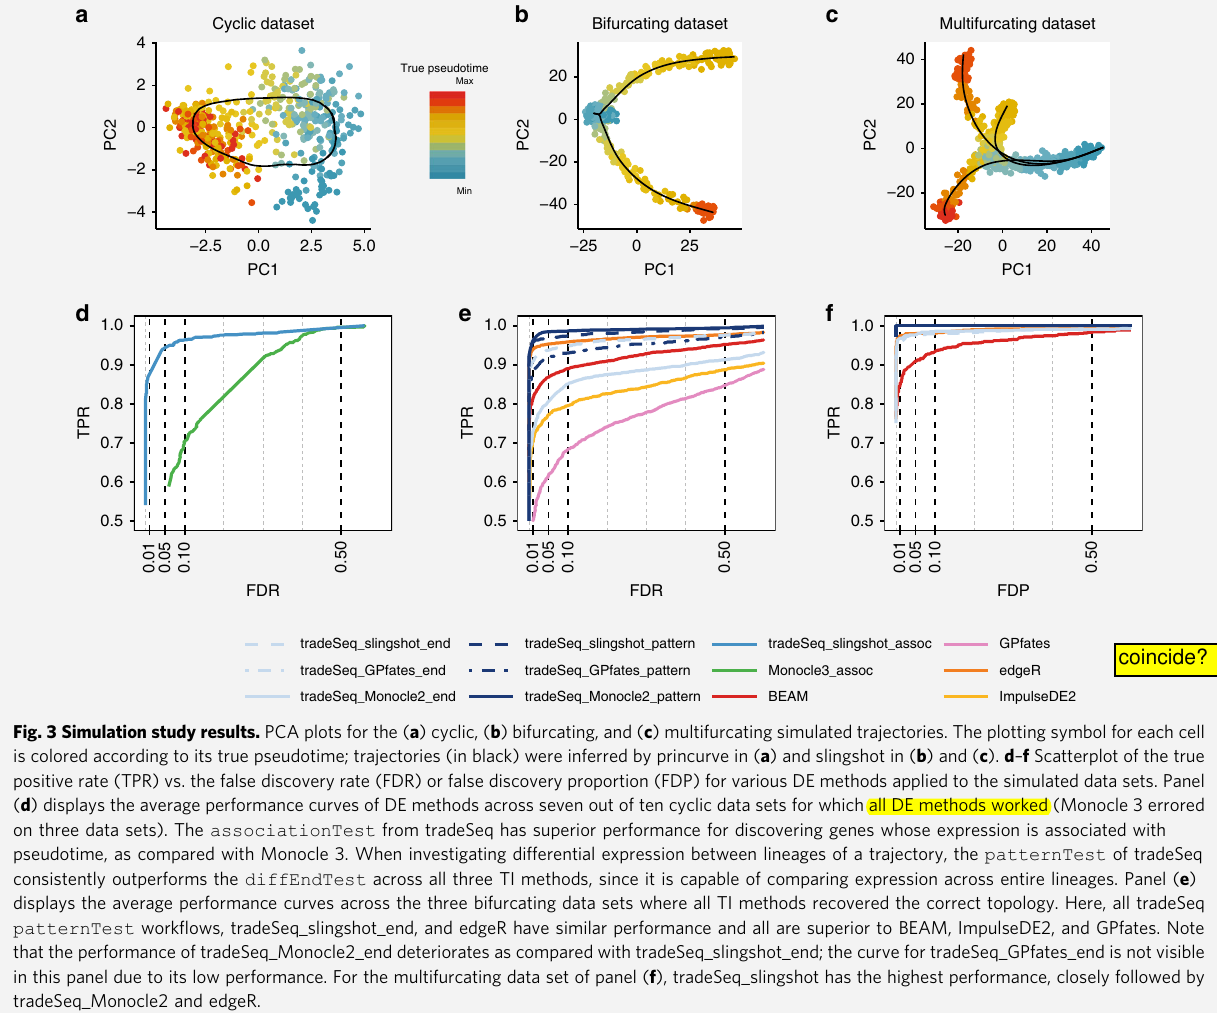
evaluate the method on simulated datasets and on real datasets from droplet-based and full-length protocols
and show that it yields biological insights through a clear interpretation of the data
Introduction
trajectory inference (TI) methods aim to first allocate cells to lineages and then order them based on pseudotimes within these lineages
Most TI methods share a common workflow: dimensionality reduction followed by inference of lineages and pseudotimes in the reduced dimensional space.
- In that reduced dimensional space, a cell’s pseudotime for a given lineage is the distance, along the lineage, between the cell and the origin of the lineage.
- while pseudotime can be interpreted as an increasing function of true chronological time, there is no guarantee that the two follow a linear relationship
Unfortunately, statistical inference methods are lacking to identify genes associated with lineage differentiation and to unravel how their corresponding transcriptional profiles are driving the dynamic processes under study.
- differential expression (DE) analysis of individual genes along lineages is often performed on discrete groups of cells in the developmental pathway, e.g., by comparing clusters of cells along the trajectory or clusters of differentiated cell types
- such discrete DE approaches do not exploit the continuous expression resolution that can be obtained from pseudotemporal ordering of cells along lineages provided by TI methods
- compare cell clusters within or between lineages can obscure interpretation: it is often unclear which clusters should be compared, how to properly combine the results of several pairwise cluster comparisons, or how to account for the fact that not all of these comparisons are independent of each other.
For bulk RNA-seq time-series data, which can exploit the temporal resolution of samples assayed at different times. However, in scRNA-seq, the relationship between gene expression and pseudotime is more complex. In addition, the pseudotimes are continuous, and cells are never at the exact same pseudotime value.
a few methods
- Monocle: test whether gene expression is associated with pseudotime by fitting additive models of gene expression as a function of pseudotime. However, it can only handle a single lineage
- TSCAN: similar to Monocle
- GPfates: a mixture of overlapping Gaussian processes, where each component of the mixture model represents a different lineage. For each gene, it essentially tests whether gene expression is differentially associated with the two lineages.
- BEAM in Monocle2: test whether differences in gene expression are associated with particular branching events on the trajectory
However, both GPfates and Monocle 2 lack interpretability, as they cannot pinpoint the regions of the gene expression profiles that are responsible for the differences in expression between lineages.
- GPfates is restricted to trajectories consisting of just one bifurcation, essentially precluding its application to biological systems with more than two lineages (i.e., a multifurcation or more than one bifurcation)
- BEAM is restricted to the few dimensionality reduction methods that are implemented in the Monocle2 software, namely, independent component analysis (ICA) and DDRTree.
Hence, novel methods to infer differences in gene expression patterns within or between transcriptional lineages with complex branching patterns are vital to further advance the field.
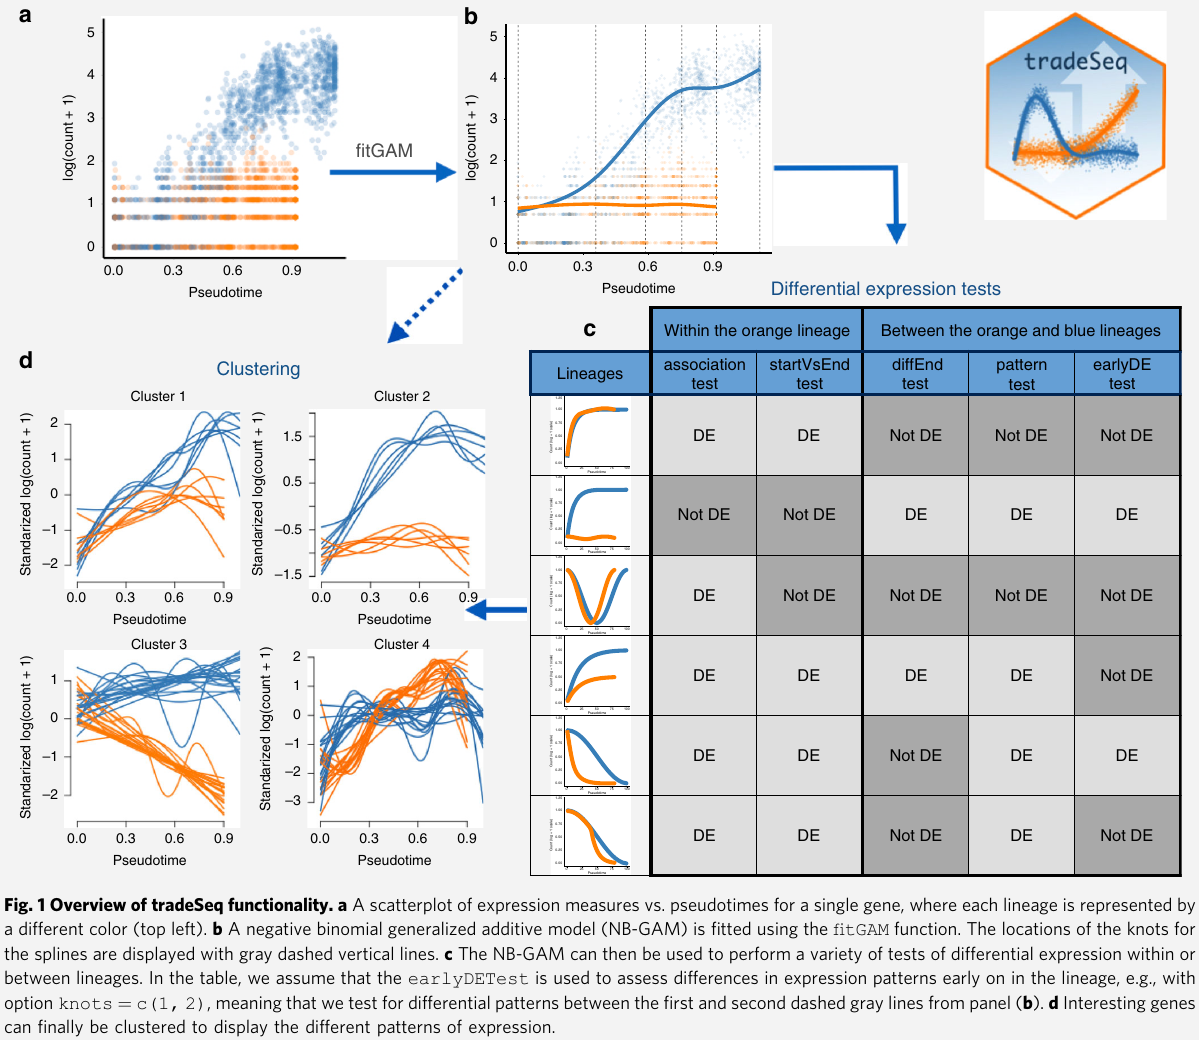
Unlike previously proposed approaches, tradeSeq provides several tests that each identify a distinct type of differential expression pattern along a lineage or between lineages.
- tradeSeq infers smooth functions for the gene expression measures along pseudotime for each lineage using generalized additive models
- and tests biologically meaningful hypotheses based on parameters of these smoothers
tradeSeq requires
- the original expression count matrix of the individual cells
- estimated pseudotimes
- a hard or soft assignment (weights) of the cells to the lineages to infer the lineage-specific smoothers.
Results
Statistical model and inference using tradeSeq
- read counts: $Y_{gi}$
- gene $g\in {1,\ldots, G}$
- cells $i\in {1, \ldots, n}$
- cell and gene-specific means $\mu_{gi}$
- gene-specific dispersion parameter $\phi_g$
- lineage $\ell\in {1,\ldots, L}$
- $\bZ = (Z_{li}\in {0, 1})$ assigns every cell to a particular lineage based on user-supplied weights
- $\cL_\ell = {i: Z_{li}=1}$ denote the set of cells assigned to lineage $l$
- $\bU$: an $n\times p$ matrix. $p$ known cell-level covariates (e.g., batch, age, or gender)
- $\bfalpha_g$: regression parameter of dimension $p\times 1$
- $N_i$: differences in sequencing depth or capture efficiency between cells are accounted for by cell-specific offsets $N_i$
The smoothing spline $s_{gl}$, for a given gene $g$ and lineage $l$, can be represented as a linear combination of $K$ cubic basis functions
\[s_{gl}(t) = \sum_{k=1}^K b_k(t)\beta_{glk}\,.\]assess DE within or between lineages by comparing the parameters $\beta_{glk}$ of these smoothing splines.
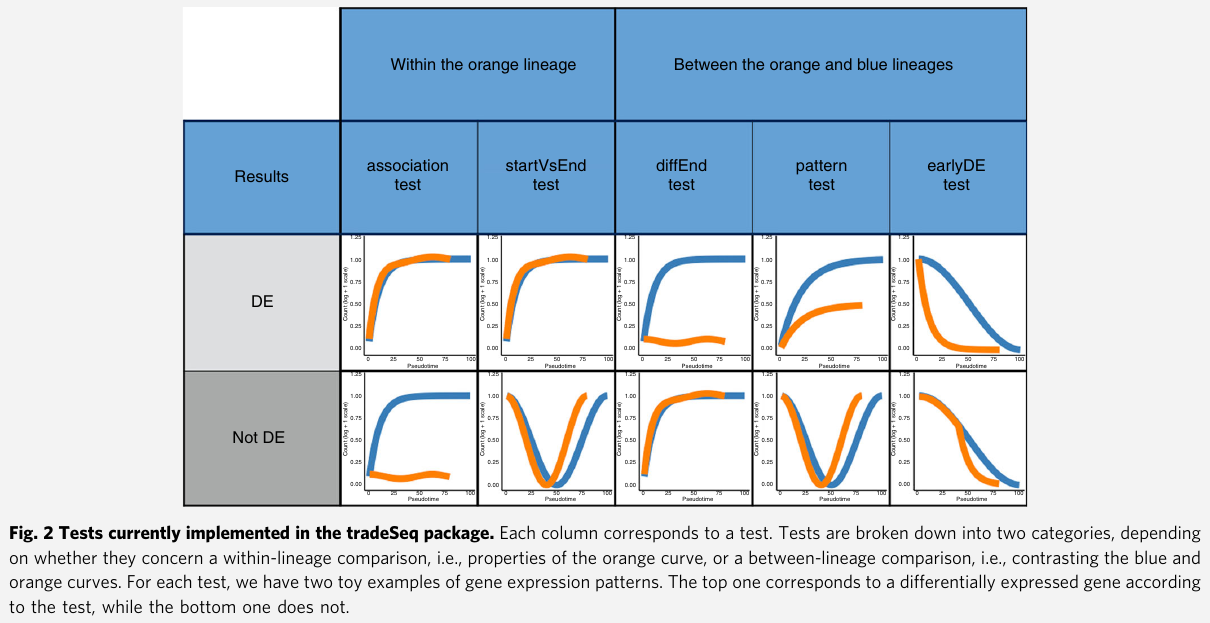
- Within-lineage comparison tests
associationTest: tests the null hypothesis that all smoother coefficients within the lineage are equal. $H_0: \beta_{glk}=\beta_{glk’}$ for all $k\neq k’\in {1,\ldots, K}$startVsEndTest: compares mean expression at the progenitor (祖先,创始人,先驱) state (i.e., the start of the lineage) to mean expression at the differentiated state (i.e., the end of the lineage)
- Between-lineage comparison tests
diffEndTest: compare average expression at the differentiated states of multiple lineages, i.e., it compares the endpoints of different lineage-specific smootherspatternTest: compare the expression patterns along pseudotime between lineages by contrasting a fixed set of equally spaced pseudotimes.earlyDETest: aim to identify genes that are differentiating around a branching of the trajectory. Not using points from the beginning to the end of the lineages as in thepatternTest, it relies on points over a shorter range of time.
- Global testing: investigate multiple lineages
- the null hypothesis is $H_0: \forall l$ and $k \neq k’$, $\beta_{glk}=\beta_{glk’}$
- Stage-wise testing: aim to control the overall false discovery rate,. It is in two stages
- screening: each gene is screened by performing a global test across all null hypothesis of interest. FDR is set as $\alpha_1$
- confirmation: each specific hypothesis is assessed, but only for the genes that have passed the screening stage. For each gene, the FWER is controlled at level $\alpha_2 = R/G\alpha_1$, where $R$ denotes the number of genes that had their global null hypothesis rejected at the screening stage and $G$ the total number of genes assessed.
- Heller et al. proved that this procedure controls the overall FDR at level $\alpha_1$.
Mouse bone marrow (骨髓) data set
-
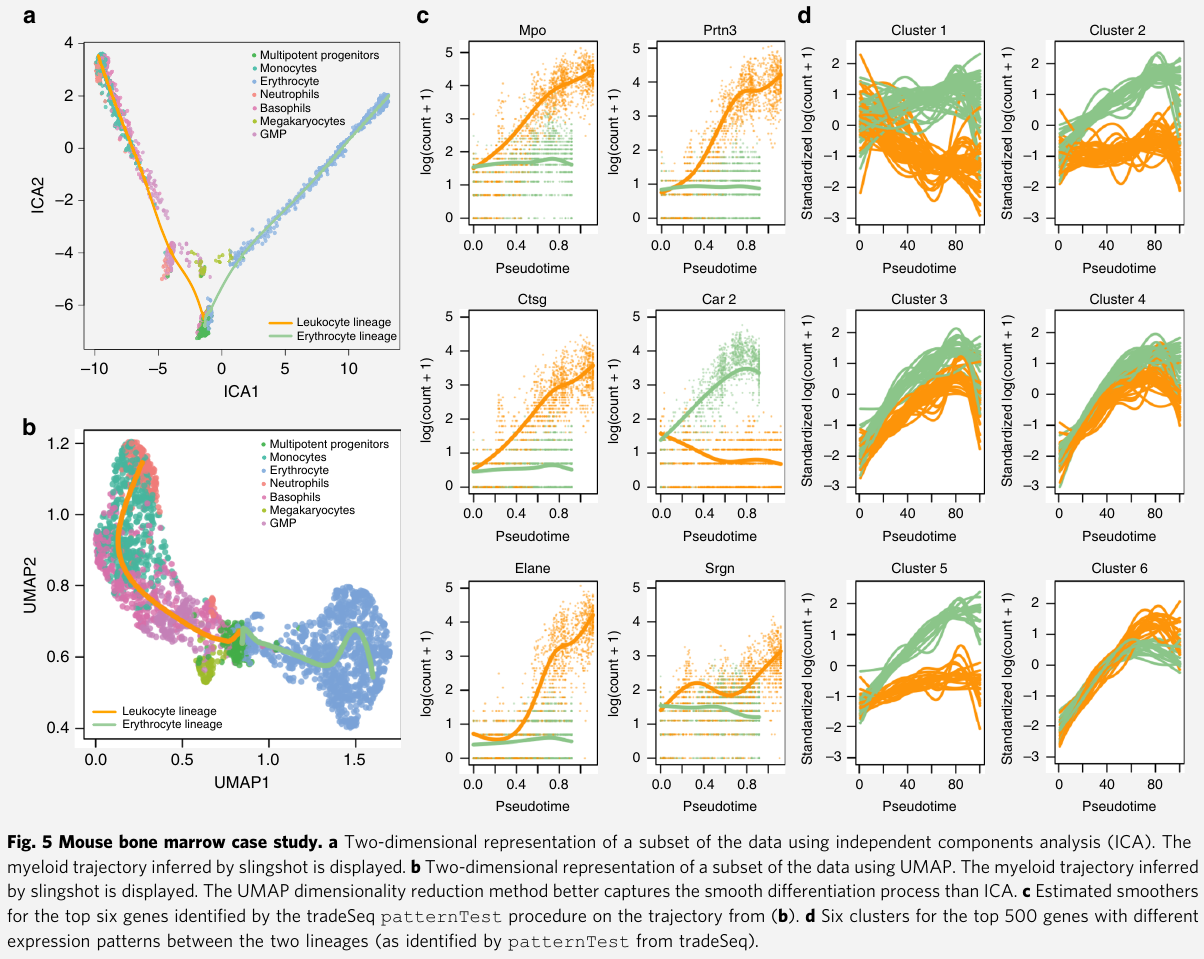
Paul et al: study the evolution of gene expression for myeloid (骨髓的) progenitors in mouse bone marrow. They construct a reference compendium (汇编) of marker genes that are indicative of development from myeloid multipotent (多能干细胞) progenitors to erythrocytes (红血细胞) and several types of leukocytes (白血细胞).
-
In order to compare the approach with BEAM, they are restricted to the dimensionality reduction procedures implemented in Monocle 2.
- first used ICA as dimensionality reduction method, but observed that this approach does not fully preserve the underlying biology
- also tradeSeq_slingshot analysis based on UMAP dimensionality reduction
apply tradeSeq with 6 knots, as found to be optimal by the AIC
- Discovering cell type markers: first identify marker genes for the progenitor and differentiated cell types
- find marker genes for the progenitor cell population vs the differentiated leukocytes or erythrocytes with the
startVsEndTestprocedure - discover marker genes for the differentiated cell types. compare the differentiated leukocyte and erythrocyte cells themselves by contrasting the endpoints of the smoothers with the
diffEndTestprocedure - tradeSeq finds 2233 significantly differentiated expressed genes at a 5% FDR level when testing whether the association between gene expression and pseudotime depends on the lineage
- find marker genes for the progenitor cell population vs the differentiated leukocytes or erythrocytes with the
- Discovering progenitor population markers: assess which genes behave differently along the two lineages
- identify genes with significantly different expression patterns between lineages via
patternTest - the top six genes are all confirmed as biomarkers in the extensive analysis of the original manuscript
- identify genes with significantly different expression patterns between lineages via
- Gene expression families: how one can group genes in clusters that share similar expression patterns
- cluster the expression patterns for genes that were deemed significant by
patternTest, this identifies gene families that have similar expression patterns within every lineage
- cluster the expression patterns for genes that were deemed significant by
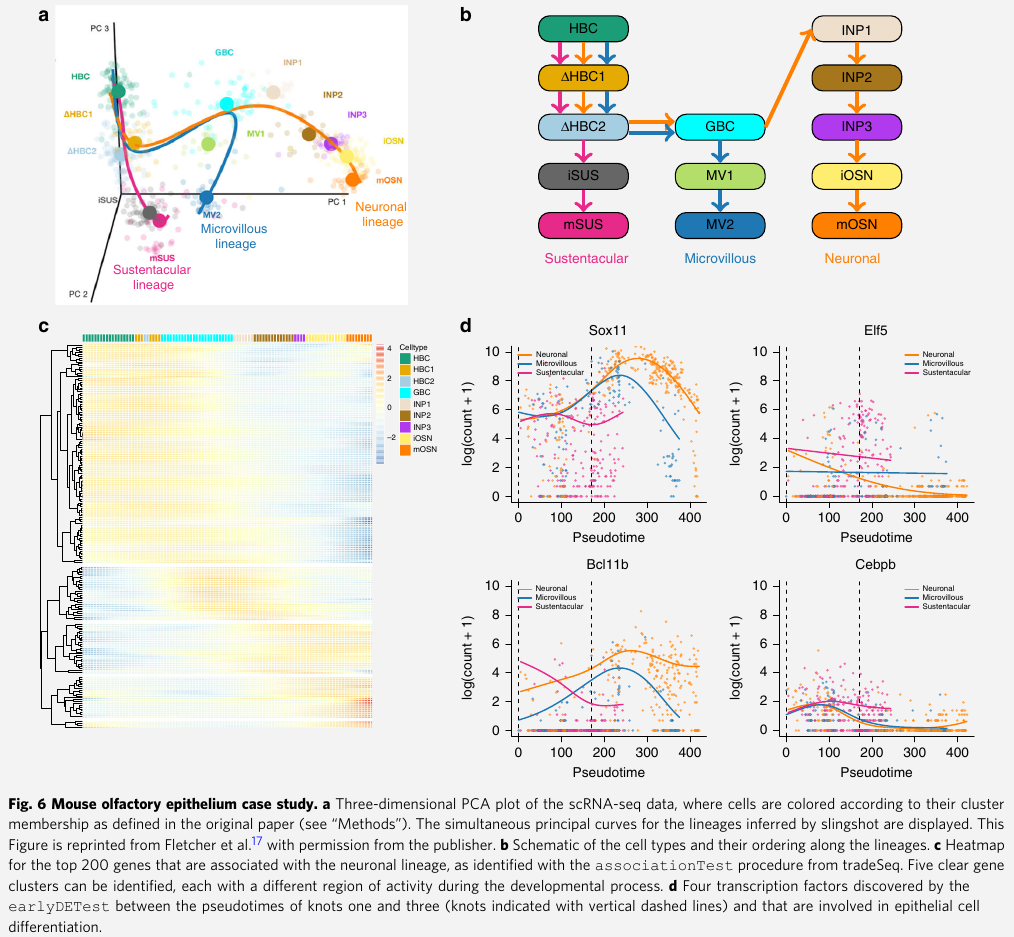
Mouse olfactory epithelium (嗅觉上皮) data set
- Fletcher et al:
- they activate the HBCs to be primed for development, which subsequently give rise to three different cell types
- sustentacular cells
- microvillous cells
- olfactory sensory neurons
- they activate the HBCs to be primed for development, which subsequently give rise to three different cell types
- Within-lineage DE
- consider differential expression along the neuronal lineage
- with
associationTest, recover 2730 genes at 5% nominal FDR level - within the top DE genes, clear clusters of expression can be observed