A Stochastic Model for Evolution of Metabolic Network
Posted on (Update: )
This post is the notes for Mithani et al. (2009).
Abstract
Motivation
- Most current (2009) research in network evolution: Duplication Attachment model where the network is only allowed to grow, but the evolution of metabolic networks is characterized by gain as well as loss of reactions.
- desire to have a biologically relevant model of network evolution that could be used to calculate the likelihood of homologous metabolic networks
Contributions
- Describe metabolic network evolution as a discrete space continuous time Markov process;
- Introduce a neighbor-dependent model for the evolution of metabolic networks where the rates with which reactions are added or removed depend on the fraction of neighboring reactions present in the network.
- Present a Gibbs sampler for estimating the parameters of evolution without exploring the whole search space by iteratively sampling from the conditional distributions of the paths and parameters.
- Use a MH algorithm for sampling paths between two networks and calculating the likelihood of evolution.
Introduction
Background
- the development of computational and mathematical techniques allowing modeling of biological networks, including
- protein interaction networks
- metabolic networks
- gene regulatory networks
- The evolution of metabolic networks is characterized by gain and loss of reactions (or enzymes) connecting two or more metabolites.
- Most of the current research focuses on Duplication Attachment model (new nodes and edges are probabilistically added depending on a set of parameters, NOT allow deletions of nodes or edges)
- Current models represent networks as directed or undirected graphs where nodes represent biological entities (proteins or metabolites), and the presence of an edge between two nodes indicates the presence of some sort of relation between the nodes.
- Drawback: cannot capture the relationships between more than two nodes, e.g, multiple metabolites in a reaction.
Their work
- discrete space continuous time Markov process allowing both insertion and deletion of reactions.
- represent metabolic networks as directed hypergraphs, loss or gain of reactions can be regarded as loss or gain of hyperedges.
- neighbor-dependent model where the rates with which reactions are added or removed depend on the fraction of neighboring reactions present in the network, two actions are considered to be neighbors if they share at least one metabolite.
- the likelihood of evolution from one network to another for fixed parameter values can be calculated by integrating over the paths between the two networks.
- Metropolis-Hastings algorithm: approximate the likelihood of evolution by summing over the unique paths visited by the sampler.
- Gibbs sampler estimates the parameters without exploring the whole search space by iteratively sampling from the conditional distributions of the paths and parameters.
Methods
Assume
- the number of nodes $N$ is fixed
- a set of hyperedges $\cal \epsilon$, and $\vert \cE \vert = M$
- there is a reference network, assuming that hyperedges in the reference network are labeled $1$ to $M$
- a reversible reaction is represented by two hyperedges. The total number of hyperedge $M$ in a metabolic network then corresponds to $R$ reactions out of which $K$ are reversible, i.e $M=R+K$.
Network evolutions
Consider a metabolic network represented as a hypergraph.
- At each step of the network evolution, an hyperedge is either added or deleted until the desired network is obtained. Modeling network evolution as a Markov process implies that the future dynamics of the system is determined by the current state of the network where a state is defined as the current configuration of the network
- The waiting time between the events are exponentially distributed and the average waiting time of the network before an insertion or deletion event takes place is a function of the entire network and depends on the number of edges that can be inserted or deleted from the network and the rates at which hyperedges can be changed.
Suppose the current state is $G$, the next state is characterized by insertion or deletion of a single hyperedge from the current network.
- insertion rate: $\lambda$
- deletion rate: $\mu$
- a set of networks reachable by insertion of a single hyperedge from state $G$: $I(G)$
- a set of networks reachable by deletion of a single hyperedge from state $G$: $D(G)$
the dynamics of the system can be described by the following master equation
\[\frac{dP(G)}{dt} = \mu \sum_{G'\in I(G)} P(G') + \lambda \sum_{G''}P(G'') - P(G)\left( \lambda \vert I(G)\vert + \mu \vert D(G)\vert \right)\]To make the model biologically relevant, define
- core edges: hyperedges that cannot be deleted during the course of evolution,
- prohibited edges, hyperedges that cannot be added to a network.
Models
Independent edge model
assume each hyperedge evolves separately, the corresponding Markov chain can be described by a 2x2 rate matrix (seems that it also assumed change one point one time, hence firstly select the position to change and then apply the rate matrix, is that OK?)
\[Q = \begin{bmatrix} -\lambda & \lambda\\ \mu & -\mu \end{bmatrix}\]the transition probability matrix is
\[P(t)=\exp(tQ)\,,\]problem: the reactions in metabolic networks do not evolve independently.
Neighbor-dependent model
hyperedge are inserted or deleted depending on their neighbors.
neighbor dependence in the context of DNA sequence evolution has been well characterized, but not much explored in the context of metabolic networks.
the neighbor-dependent model relates to the preferential attachment property reported for metabolic network evolution and produces a behavior such that highly connected hyperedges are added or removed more frequently than those hyperedges which have very few neighbors.
Consider a network $x = (x_1,\ldots,x_M)$. Let $x’$ be a network that differs from $x$ at position $i$, then the value at position $x_i’ = 1-x_i$. The rate from $x$ to $x’$ depends on $x_i, x_i’$ and the neighboring hyperedges $\Psi(x_i)$ present in the network $x$,
\[\gamma(x_i';x_i, \Psi(x_i)) = q(x_i, x_i')F(x_i, \Psi(x_i))\,,\]where $q(x_i, x_i’)$ is the appropriate entry from the rate matrix $Q$ (but only two choice, right? since there must be a change according to the assumption), and the neighborhood component
\[F(x_i,\Phi(x_i))=\left\{ \begin{array}{ll} \frac{\vert \Phi(x_i)\vert}{\sum_{i\neq j}x_j},&\vert \Phi(x_i)\vert >0,\\ \frac{1}{M+1},&\text{Otherwise} \end{array} \right.\]Note that the neighbors are defined via the reference network.
Implement in Julia
function neigh_comp(adj_ref::Array, x::Array)
    f = ones(num_edges)
    for i = 1:num_edges
        num_neigh = sum(adj_ref[i, :] .* x)
        if num_neigh == 0
            f[i] = 1 / (num_edges + 1)
        else
            if x[i] == 1
                f[i] = num_neigh / ( sum(x) - 1 )
            else
                f[i] = num_neigh /  sum(x)
            end
        end
    end
    return(f)
end
Test with two cases,
julia> neigh_comp(adj_ref, H1)[7]
0.7142857142857143

julia> neigh_comp(adj_ref, H2)[7]
0.75
which agree with the results in the supplementary material.
The role of current metabolites: it has been argued that using current metabolites in an analysis may lead to biologically incorrect results.
- in-degree of a hyperedge $e$: the number of hyperedges that share at least one of their products with substrates of the hyperedge $e$
- out-degree of a hyperedge $e$: the number of hyperedges sharing at least one of their substrates with products of the hyperedge $e$
Evolutionary path
Successive networks during the course of evolution differ only by a single edge. At each step, an edge is either inserted or deleted from the network. We refer to the addition or deletion of an edge as an event and define a path between two networks as a sequence of events that transform the first network to the second.
Formally, for a given pair of networks $x$ and $x’$, which differ by $d$ number of hyperedges, a path of length $k (k\ge d)$ denoted by $z_k$ is a sequence
\[[e_1,e_2,\ldots,e_k]; e_i\in \cE\]consisting of edge-toggle events that lead the network $x$ to the network $x’$.
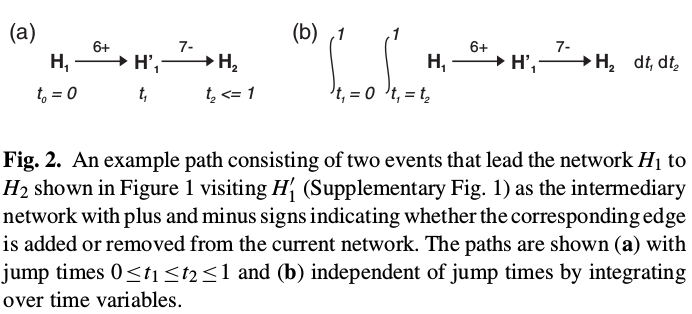
In general, the likelihood value can be obtained by integrating over variables $t_i, 1\le i\le k$ such that $0\le t_1\ldots\le t_k\le 1$ as follows
\[P(z_k\mid x(0)) = \int_{t_1=t_0}^1\cdots \int_{t_k=t_{k-1}}^1f(z_k\mid x(0))dt_1\ldots dt_k\,,\]which can be calculated by the trajectory likelihood algorithm.
Datasets: Metabolic networks
Metabolic network data were extracted from the KEGG database for three different pathway maps across four species belonging to the genus Pseudomonas.
The basic information for each network is given in the following Supplementary Table 1.
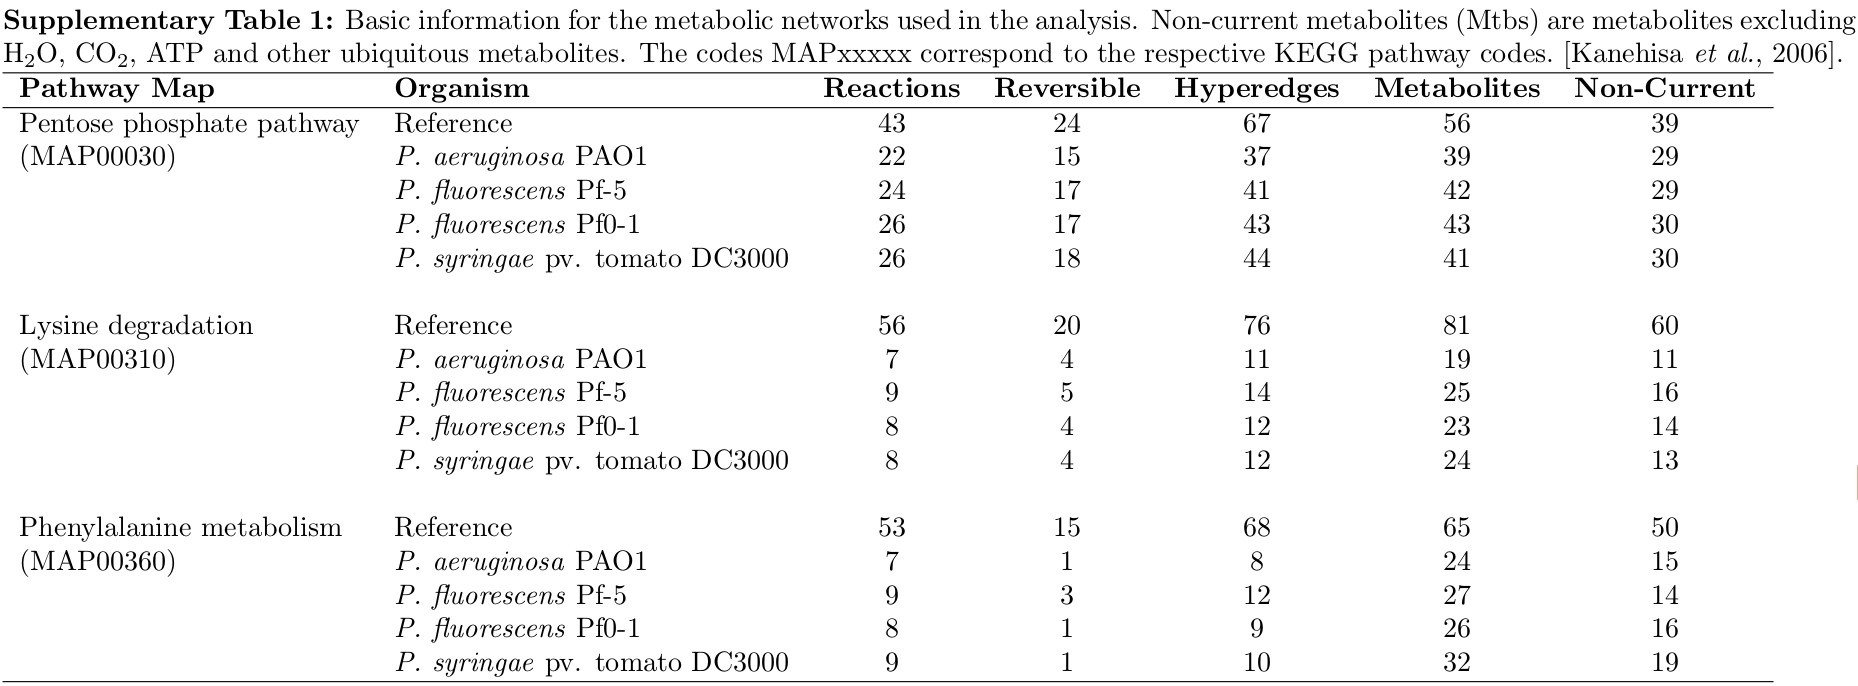
For example, MAP00030 in P.fluorescens Pf0-1 contains 26 out of a possible 43 reactions, of which 17 are reversible, requiring 43 hyperedges in the reconstructed network.
current metabolites: Compounds such as H2O, CO2, ATP and other ubiquitous metabolites, and were ignored.
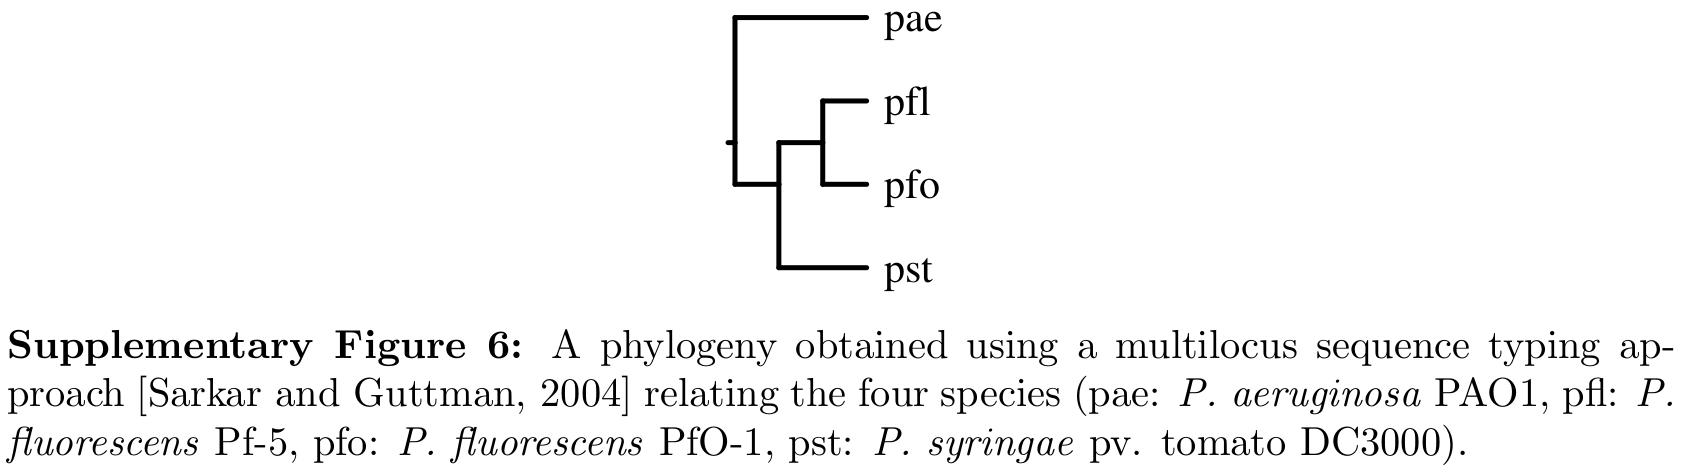
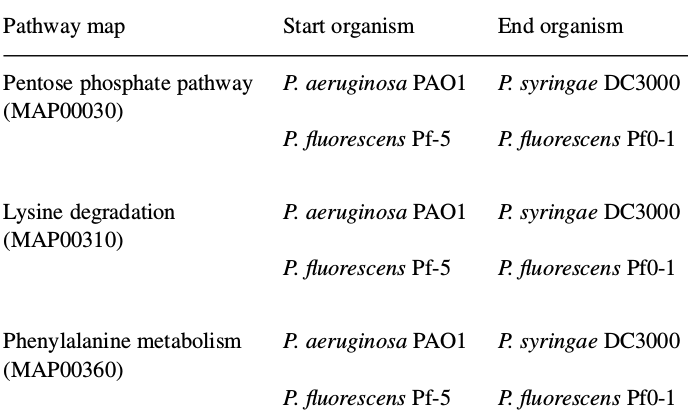
Apply the Gibbs sampler on the metabolic networks. Evolution parameters were estimated for evolution between two independent pairs,
- from P.fluorescens Pf-5 (pfl) to P.fluorescens Pf0-1 (pfo)
- from P.aeruginosa PAO1 (pae) to P. syringae pv. tomato DC3000 (pst)
In a separate study, the authors identified hyperedges that were common to or absent from nine genome sequenced strains of Pseudomonas. To study the effects of core and prohibited hyperedges in the model, use
- hyperedges common to all nine strains of Pseudomonas as core edges
- hyperedges not present in any of these strains as prohibited edges
then estimate the parameters for the evolution of metabolic networks with and without core and prohibited edges in the model using the Gibbs sampler.
Discussion
The simulation results suggest that the neighbor-dependent model produces a behavior where highly connected nodes tend to go through a high number of insertions thus agreeing with the common notions of “popularity is attractive” and preferential attachment for biological networks.
In a metabolic network, this model favors the insertion of edges that complete pathways and connect metabolites to hub metabolites, and favors deletion of non-core edges that correspond to redundant connections in a network.
Limitations associated with the neighbor-dependent model: exclude current metabolites such as H2O, CO2 and ATP, which in turn can lead to exclusion of neighborhood for reactions for which current metabolites are the sole substrate or product.
The evolution of metabolic networks is complex and involves other factors such as response to environmental, developmental or physiological stimuli as well as lateral gene transfers that are not addressed by this model.
Extensions: taking into account reaction structure - a reaction which involves fewer metabolites or is chemically more efficient way be assigned higher weight than a reaction which uses a larger number of metabolites or is difficult to carry out
In this study, assume that reversible reactions are lost or added in two independent steps. It would be desirable to allow the deletion or insertion of reversible reactions in a single step with a certain probability as a single enzyme might be catalyzing a reversible reaction in both directions.
In addition, ortholog (直系同源) and synteny (同线型) data could be used to weight each hyperedge. The idea being that if a reaction is present in most of the species that are evolutionarily close to the one being considered then it has higher chances of being added, and if it is genetically linked to other reactions then they have a greater chance of being consecutively added or deleted.
Results
Discussion
- We can estimate the parameters of evolution between different pairs of bacteria and can use network structure to provide clues about the metabolic similarity of bacteria.
-
A logical extension to the work presented here would be to calculate the likelihood and estimate the parameters over a phylogeny, which is known through sequence analysis.
- hybrid model \(\omega(x_i;x_i)=\delta q(x_i,x_i')F(x_i,\Phi(x_i))+(1-\delta)q(x_i,x_i')\)
- an edge was then selected based on these rates and was inserted if absent from the current network and deleted otherwise.
- evolution on a phylogeny
- sampling internal nodes
sth
- can the allowed hyperedge reduce the dimensionality?
- sequence analysis–> SDA??