Cox Regression
Posted on (Update: )
Survival analysis examines and models the time it takes for events to occur. It focuses on the distribution of survival times. There are many well known methods for estimating unconditional survival distribution, and they examines the relationship between survival and one or more predictors, usually terms covariates in the survival-analysis literature. And Cox Proportional-Hazards regression model is one of the most widely used method of survival analysis.
Terminology
- $T$ represents survival time;
- $P(t)=\Pr(T\le t)$ is the cumulative distribution of random variable $T$;
- $p(t)=dP(t)/dt$ is the probability density function;
- $S(t) = \Pr(T>t)=1-P(t)$ is the survival function.
- $h(t)$ is the hazard function, which assesses the instantaneous risk of demise (死亡,逝世) at time $t$, conditional on survival to that time.
Let’s take three kinds of hazard function, and they imply different distribution of survival times.
- If $h(t)=\nu$, where $\nu$ is a constant, it implies an exponential distribution of survival time.
- If $\log h(t)=\nu +\rho t$, it implies the Gompertz distribution of survival times.
- If $\log h(t)=\nu+\rho \log(t)$, it implies the Weibull distribution of survival times.
Censoring is a nearly universal feature of survival data, and there are three forms of censoring. Let me explain them in a medical study.
- right-censoring: some individuals may still be alive at the end of a medical study, or may drop out of the study for various reasons.
- left-censored: its initial time is unknown.
- interval-censoring: both right and left-censored.
Kaplan-Meier Estimator
Suppose that $S_{i-1}$ subjects have survived up to time $t_{i-1}$ and not censored at time $t_{i-1}$, of whom $S_i$ survive, $d_i$ fail, and $l_i$ are censored at time $t_i,i=1,\ldots,k$. The Kaplan-Meier estimator of the survival probability at time $t_i$ is \(\hat S(t_i) = \left(1-\frac{d_1}{S_0}\right)\times \left(1-\frac{d_2}{S_1}\right)\times \cdots \times \left(1-\frac{d_i}{S_{i-1}}\right), i=1,\ldots,k\,.\)
The Cox Proportional-Hazards Model
Survival analysis typically examines the relationship of the survival distribution to covariates. For example, a parametric model based on the exponential distribution may be written as,
\[\log h_i(t)=\alpha+\beta_1x_{i1}+\beta_2x_{i2}+\cdots+\beta_kx_{ik}\]where the constant $\alpha$ in the above model represents a kind of log-baseline hazard.
In contrast, the cox model leaves the baseline hazard function $\alpha(t)=\log h_0(t)$ unspecified:
\[\log h_i(t)=\alpha(t)+\beta_1x_{i1}+\beta_2x_{i2}+\cdots+\beta_kx_{ik}\]The model is semi-parametric because while the baseline hazard can take any form, the covariates enter the model linearly. Consider two observations $i$ and $i’$,
\[\eta_i=\beta_1x_{i1}+\beta_2x_{i2}+\cdots+\beta_kx_{ik}\]and
\[\eta_{i'}=\beta_1x_{i'1}+\beta_2x_{i'2}+\cdots+\beta_kx_{i'k}\]The hazard ratio for these two observations,
\[\frac{h_i(t)}{h_{i'}(t)}=\frac{\exp(\eta_i)}{\exp(\eta_{i'})}\]is independent of time $t$. Consequently, the Cox model is a proportional-hazards model.
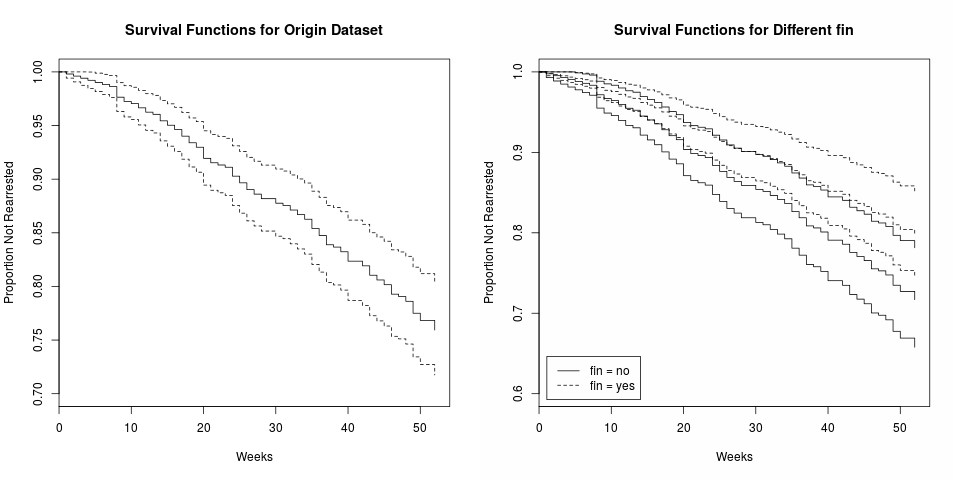
An Illustration
The details of dataset can refer to the references at the end of this post.
Note that there is no intercept term in cox model, so do not use 1 + x in the formula.
test1 <- list(time=c(4,3,1,1,2,2,3),
              status=c(1,1,1,0,1,1,0),
              x=c(0,2,1,1,1,0,0),
              sex=c(0,0,0,0,1,1,1))

> coxph(Surv(time, status) ~ 1, test1)
Call:  coxph(formula = Surv(time, status) ~ 1, data = test1)

Null model
  log likelihood= -6.040255
  n= 7
> coxph(Surv(time, status) ~ 1 + x, test1)
Call:
coxph(formula = Surv(time, status) ~ 1 + x, data = test1)

    coef exp(coef) se(coef)     z     p
x 0.4608    1.5853   0.5628 0.819 0.413

Likelihood ratio test=0.66  on 1 df, p=0.4176
n= 7, number of events= 5
> coxph(Surv(time, status) ~ x, test1)
Call:
coxph(formula = Surv(time, status) ~ x, data = test1)

    coef exp(coef) se(coef)     z     p
x 0.4608    1.5853   0.5628 0.819 0.413

Likelihood ratio test=0.66  on 1 df, p=0.4176
n= 7, number of events= 5
Wald, score, and likelihood ratio tests
Test the global null hypothesis,
- Likelihood ratio test: $2(l(\hat\beta) - l(\beta^{(0)}))$, twice the difference in the log partial likelihood at the initial and final estimates of $\hat\beta$.
- Wald test: $(\hat\beta - \beta^{(0)})’\hat I(\hat\beta - \beta^{(0)})$, where $\hat I=I(\hat\beta)$ is the estimated information matrix at the solution.
- Score test: $U’(\beta^{(0)})I(\hat\beta^{(0)})^{-1}U(\hat\beta^{(0)})$ can be computed using only the first iteration of the Newton-Raphson algorithm. Letting $\hat\beta^1$ be the first step of the solution algorithm, then $\hat\beta^1 - \beta^{(0)} = -U’(\beta^{(0)})I(\beta^{(0)})^{-1}$, showing that the score test is closely related to a Wald test based on the result of one iteration.
When $p = 1$ and the single covariate is categorical, the score test is identical to the log-rank test.
> lungfit = coxph(Surv(time, status) ~ age + sex + meal.cal, data = lung)
> summary(lungfit)
Call:
coxph(formula = Surv(time, status) ~ age + sex + meal.cal, data = lung)

  n= 181, number of events= 134
   (47 observations deleted due to missingness)

               coef  exp(coef)   se(coef)      z Pr(>|z|)
age       0.0152942  1.0154117  0.0105352  1.452    0.147
sex      -0.4914187  0.6117579  0.1908601 -2.575    0.010 *
meal.cal -0.0001341  0.9998659  0.0002383 -0.563    0.574
---
Signif. codes:  0 ‘***’ 0.001 ‘**’ 0.01 ‘*’ 0.05 ‘.’ 0.1 ‘ ’ 1

         exp(coef) exp(-coef) lower .95 upper .95
age         1.0154     0.9848    0.9947    1.0366
sex         0.6118     1.6346    0.4208    0.8893
meal.cal    0.9999     1.0001    0.9994    1.0003

Concordance= 0.604  (se = 0.029 )
Likelihood ratio test= 10.65  on 3 df,   p=0.01
Wald test            = 10.17  on 3 df,   p=0.02
Score (logrank) test = 10.33  on 3 df,   p=0.02
- The Wale test is already printed for each coefficient, e.g., the z-statistic of $0.0152942 / 0.0105352 = 1.4517237451590859$ for the age coefficient above.
- A likelihood ratio test for age requires that the data set can be refit without age
> coxph(Surv(time, status) ~ sex + meal.cal, data = lung)
Call:
coxph(formula = Surv(time, status) ~ sex + meal.cal, data = lung)

               coef  exp(coef)   se(coef)      z       p
sex      -0.5276151  0.5900104  0.1893980 -2.786 0.00534
meal.cal -0.0002164  0.9997836  0.0002343 -0.924 0.35570

Likelihood ratio test=8.5  on 2 df, p=0.01428
n= 181, number of events= 134
   (47 observations deleted due to missingness)
Thus, the LR test statistic is $10.65-8.5 = 2.15$ on $3-2=1$ degree of freedom, which differs only slightly from the Wald test for age of $1.4517237451590859^2=2.11$
Missing values in the data set can be a major nuisance when computing the LR test for a variable.
use the same patients
If we naively compute the likelihood ratio test for meal calories,
> coxph(Surv(time, status) ~ age + sex, data = lung)
Call:
coxph(formula = Surv(time, status) ~ age + sex, data = lung)

         coef exp(coef)  se(coef)      z       p
age  0.017045  1.017191  0.009223  1.848 0.06459
sex -0.513219  0.598566  0.167458 -3.065 0.00218

Likelihood ratio test=14.12  on 2 df, p=0.0008574
n= 228, number of events= 165
then the LR test statistic appears to be $10.65 - 14.12 = -3.47$, an impossibility. The reason it that it includes 47 more patients, which are missing in the first model. The correct way is
> coxph(Surv(time, status) ~ age + sex, data = lung, subset = (!is.na(meal.cal)))
Call:
coxph(formula = Surv(time, status) ~ age + sex, data = lung,
    subset = (!is.na(meal.cal)))

        coef exp(coef) se(coef)      z      p
age  0.01670   1.01684  0.01027  1.627 0.1037
sex -0.47465   0.62210  0.18861 -2.517 0.0118

Likelihood ratio test=10.33  on 2 df, p=0.00571
n= 181, number of events= 134
The resulting LR test of $10.65 - 10.33 = 0.32$ is close to the Wald value of $(-0.563)^2=0.317$.
Computation of the score test for a single coefficient of the multivariate model requires two fits to the data. Since it is a test at $\beta = 0$, the first fit is to a model without the covariate of interest in order to get appropriate initial values, and the second uses all of the covariates. ATTENTION, not familiar
> lungfita = coxph(Surv(time, status) ~ sex + meal.cal, data = lung)
> lungfitb = coxph(Surv(time, status) ~ age + sex + meal.cal, data = lung, init = c(0, coef(lungfita)), iter = 0)
> coef(lungfita)
          sex      meal.cal
-0.5276150555 -0.0002164263
> lungfita
Call:
coxph(formula = Surv(time, status) ~ sex + meal.cal, data = lung)

               coef  exp(coef)   se(coef)      z       p
sex      -0.5276151  0.5900104  0.1893980 -2.786 0.00534
meal.cal -0.0002164  0.9997836  0.0002343 -0.924 0.35570

Likelihood ratio test=8.5  on 2 df, p=0.01428
n= 181, number of events= 134
   (47 observations deleted due to missingness)
> lungfitb
Call:
coxph(formula = Surv(time, status) ~ age + sex + meal.cal, data = lung,
    init = c(0, coef(lungfita)), iter = 0)

               coef  exp(coef)   se(coef)      z       p
age       0.0000000  1.0000000  0.0101968  0.000 1.00000
sex      -0.5276151  0.5900104  0.1910618 -2.761 0.00575
meal.cal -0.0002164  0.9997836  0.0002408 -0.899 0.36873

Likelihood ratio test=0  on 3 df, p=1
n= 181, number of events= 134
   (47 observations deleted due to missingness)
>
> lungfitb$score
[1] 2.110773
>
so actually lungfitb does not further fit since the coefficients are the same with the initial one
Infinite coefficients
For the following data
| \ | Alive | Dead |
|---|---|---|
| Treatment | 40 | 0 |
| Control | 30 | 10 |
Because the treatment group has no deaths its hazard rate is 0, and the hazard ratio of control/treatment is infinite.
In this case,
\[\frac{h_i(t)}{h_{i'}(t)}=\frac{\exp(I(x_i=\text{Treatment})\beta)}{\exp(I(x_{i'}=\text{Treatment})\beta)}\]If both are in the same group, then the hazard ratio is just 1. On the other hand, if $i$ is in Treatment group while $i’$ is in the Control group, then $\frac{h_i(t)}{h_{i’}(t)} = \exp(\beta)$. Since the hazard ratio of control/treatment is infinite, i.e., the hazard ratio of treatment/control is 0, so $\beta = -\infty$. Alternatively, it would become $\infty$ if we write $\exp(I(x_i = \text{Control}))$.
In the following example, include the status variable as a predictor to force an infinite $\beta$.
in other words, the events are in the same group
> fit = coxph(Surv(futime, fustat) ~ rx + fustat, ovarian)
Warning messages:
1: In coxph(Surv(futime, fustat) ~ rx + fustat, ovarian) :
  a variable appears on both the left and right sides of the formula
2: In coxph.fit(X, Y, istrat, offset, init, control, weights = weights,  :
  Loglik converged before variable  2 ; coefficient may be infinite.
> summary(fit)
Call:
coxph(formula = Surv(futime, fustat) ~ rx + fustat, data = ovarian)

  n= 26, number of events= 12

             coef  exp(coef)   se(coef)      z Pr(>|z|)
rx     -5.566e-01  5.731e-01  6.199e-01 -0.898    0.369
fustat  2.258e+01  6.414e+09  1.387e+04  0.002    0.999

       exp(coef) exp(-coef) lower .95 upper .95
rx     5.731e-01  1.745e+00      0.17     1.932
fustat 6.414e+09  1.559e-10      0.00       Inf

Concordance= 0.897  (se = 0.037 )
Likelihood ratio test= 30.8  on 2 df,   p=2e-07
Wald test            = 0.81  on 2 df,   p=0.7
Score (logrank) test = 29.09  on 2 df,   p=5e-07

- solid line is the LR statistic, the estimated 2.258e+01 is sufficiently close to the partial likelihood at infinity.
- the score test approximates the LR test using a quadratic Taylor expansion about $\beta = 0$, as shown by the dashed line. The guessed value of -20.6 for the final value of the partial likelihood is a little small, but not bad. The maximum of the quadratic function, at $\beta = 3.4$, is the first iterate of the Newton-Raphson algorithm.
- The Wald test creates a quadratic curve based on a Taylor series about $\hat\beta$. It is shown by the dotted line, nearly indistinguishable from the horizontal dotted line that is the asymptotic value of the likelihood curve. Its test is the difference between the LR at $\hat\beta$ and the value it extrapolates to be true at zero. Because it depends on an assumption that the log partial likelihood function is a quadratic near $\hat\beta$, the Wald test is worthless in this situation.
The situation is sometimes referred to in the literature “monotone likelihood” for the Cox model, and viewed as a problem.
In a more usual case, the profile likelihood and the Wald approximation would match well,
